
Technical Report
The Cigna Group - CI - AI Score : 91.69
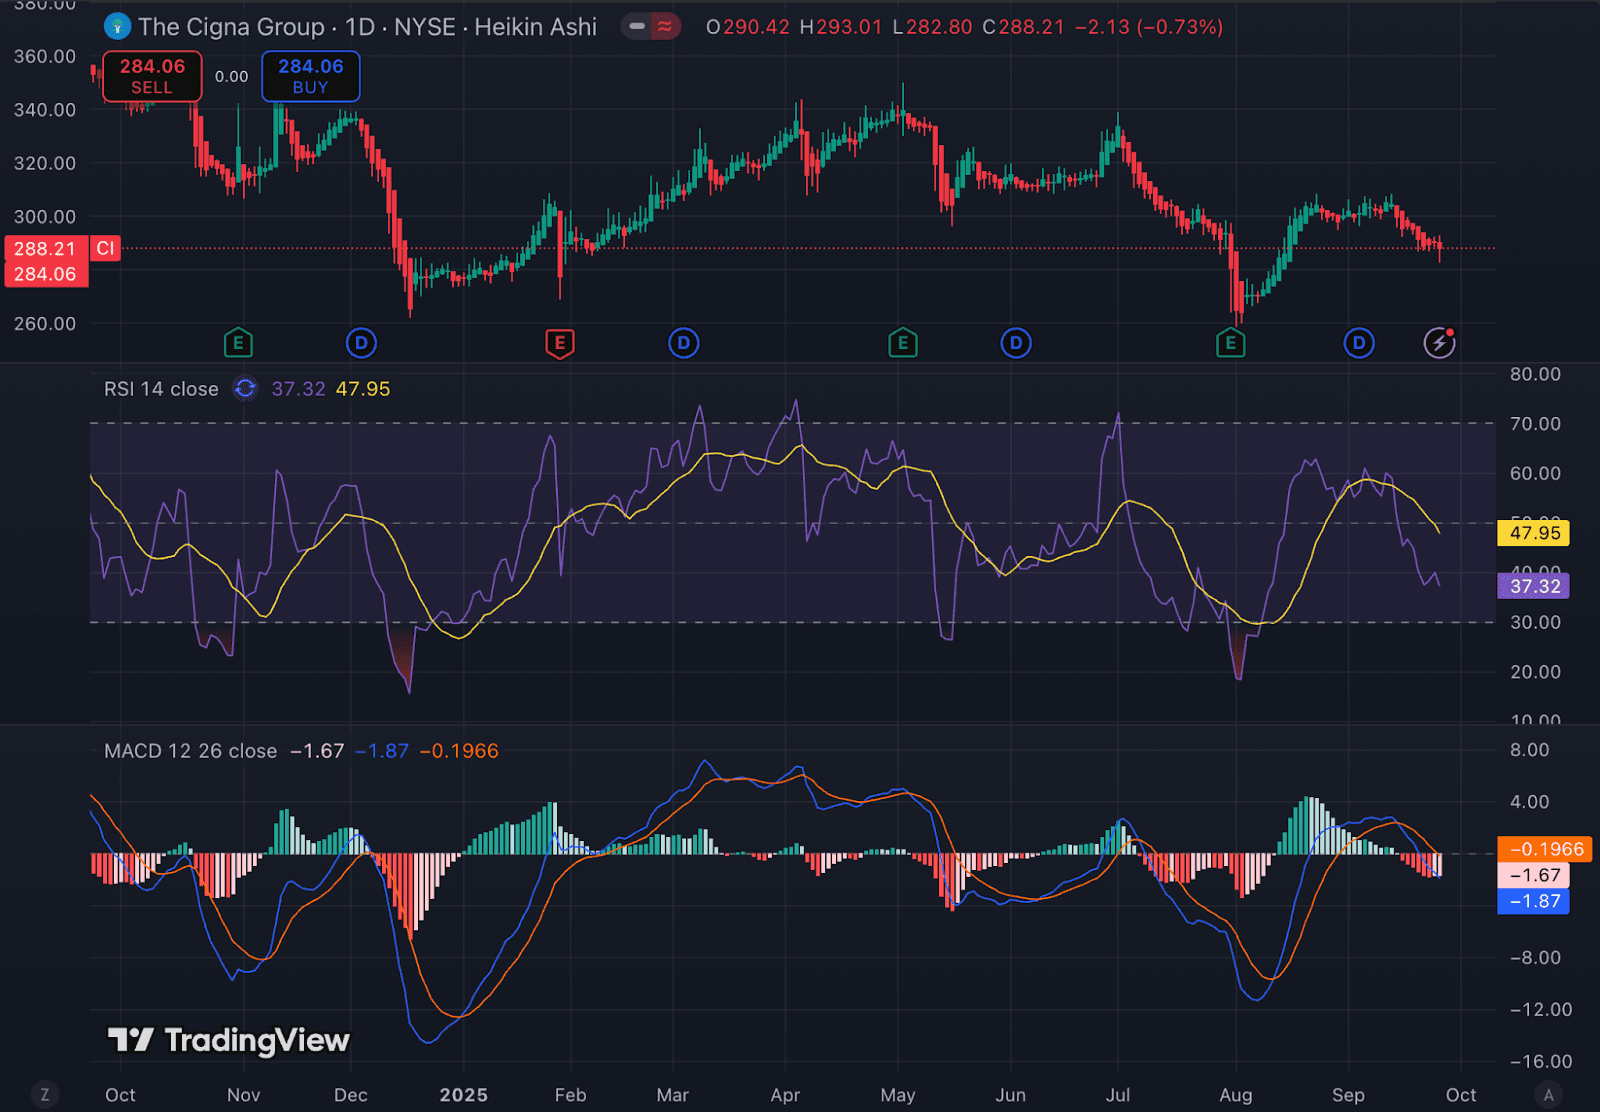
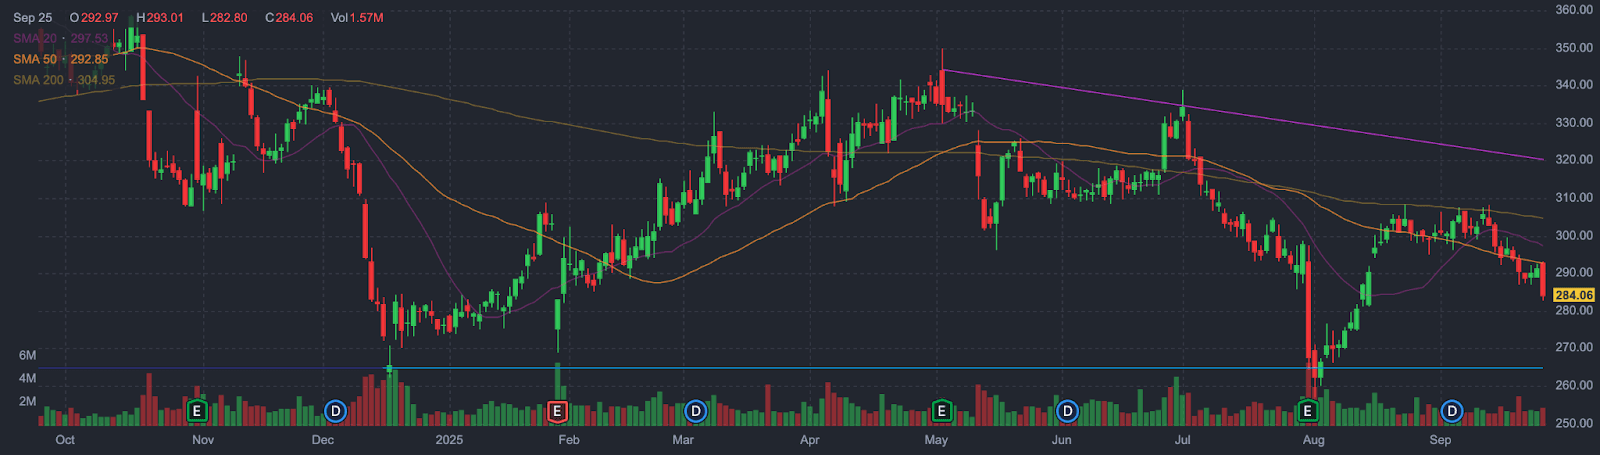
The Cigna Group (NYSE: CI) is trading near $284, slipping back after a rebound in early September failed to keep above $300. The stock is still in a corrective phase, struggling to maintain momentum after its recovery from lows around $260 in August.
From a trend perspective, CI is facing pressure. It trades below the 20-day ($297.53), 50-day ($292.85), and 200-day ($304.95) SMAs. All of these averages are sloping downward, showing ongoing downside momentum across short-, medium-, and long-term periods. The failed attempt to regain the 50-day SMA earlier this month reinforced overhead resistance, keeping the overall outlook bearish.
Momentum indicators point to continuing weakness. The RSI sits at 37.32, nearing oversold territory but still indicating that sellers are in control. The MACD line (–1.67) is below the signal line (–0.1966), and the histogram is negative. This reflects fading bullish momentum and a lack of belief in a reversal at this stage.
Structurally, CI has been caught in a series of lower highs since March. This pattern is marked by a descending trendline that continues to limit upward attempts. The recent bounce towards the $300 area was rejected, and selling volume has outpaced buying volume on down days, which shows that selling pressure remains strong.
Key levels to watch on the upside are $292 to $297. This is where the 20-day and 50-day SMAs meet. Stronger resistance follows at $305 near the 200-day SMA. On the downside, immediate support is around $280. If this level breaks, it could lead to a retest of the August low near $260. A clear move below $260 would open the path to the $250 area, which is both psychological and structural.
Cigna remains technically weak, with moving averages trending downward and momentum indicators signaling ongoing pressure. Maintaining the $280 level is crucial to avoiding a deeper pullback. Reclaiming $305 would be the first meaningful step toward stabilizing the longer-term trend.
Fiserv, Inc. - FI - AI Score : 91.62
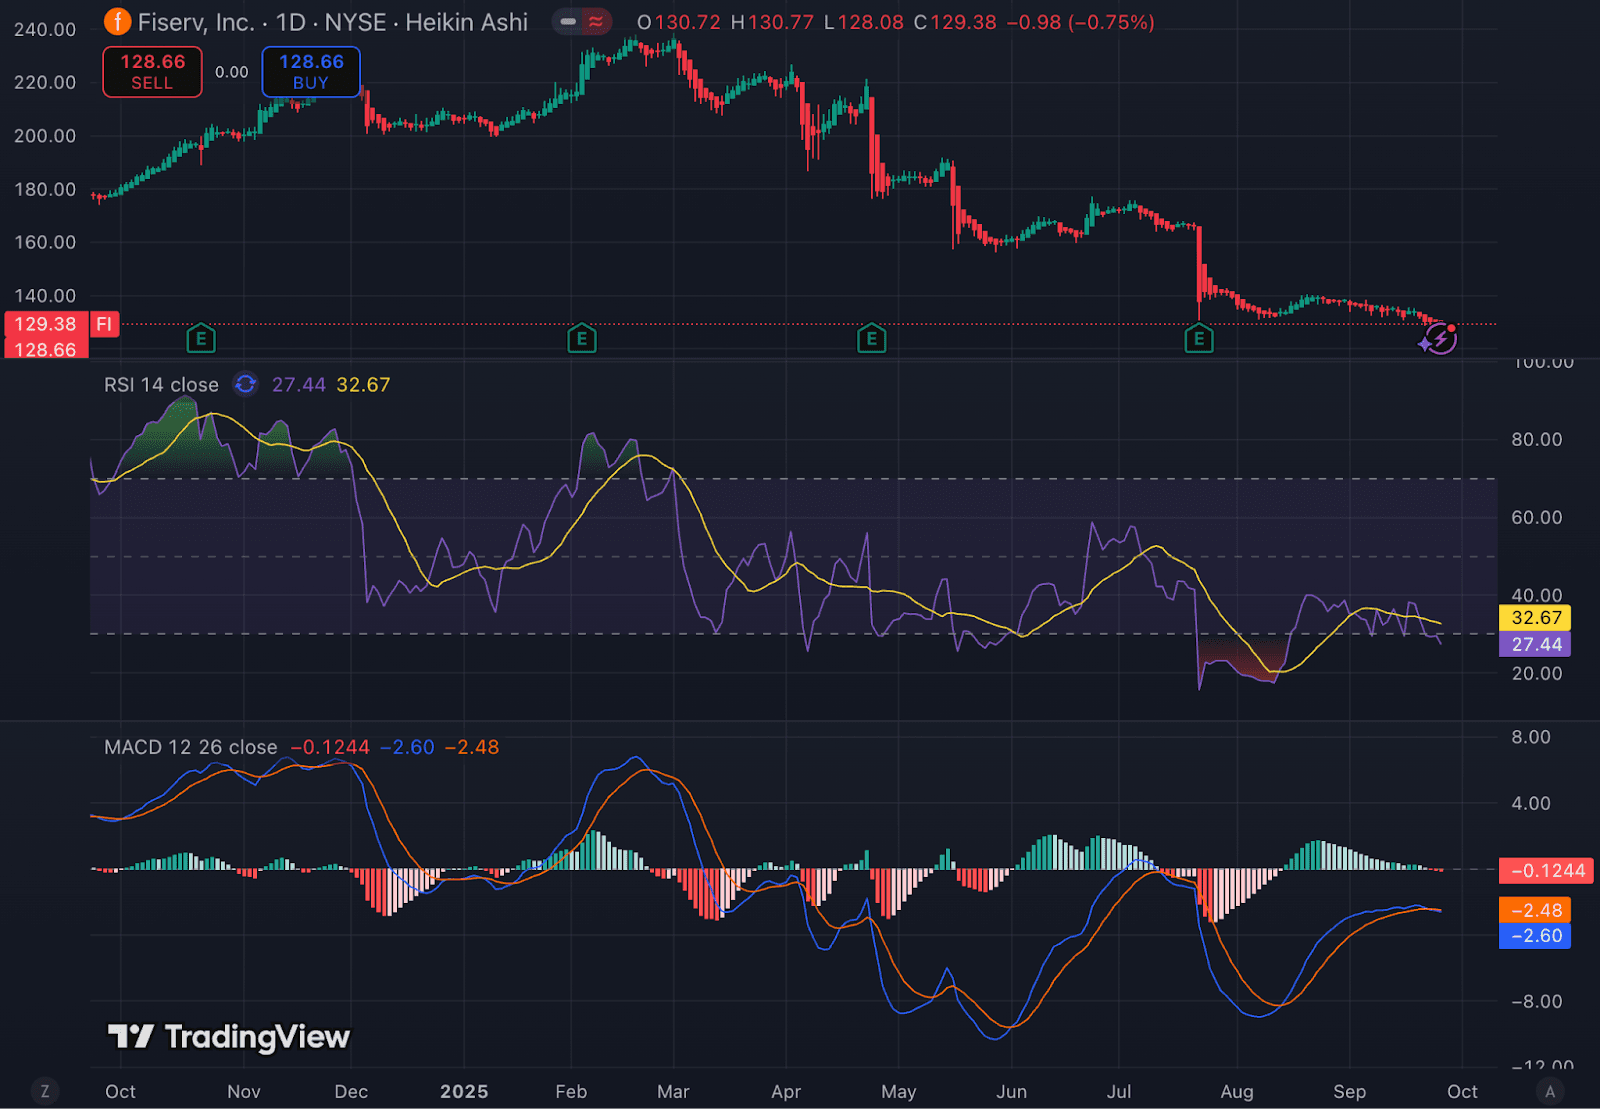
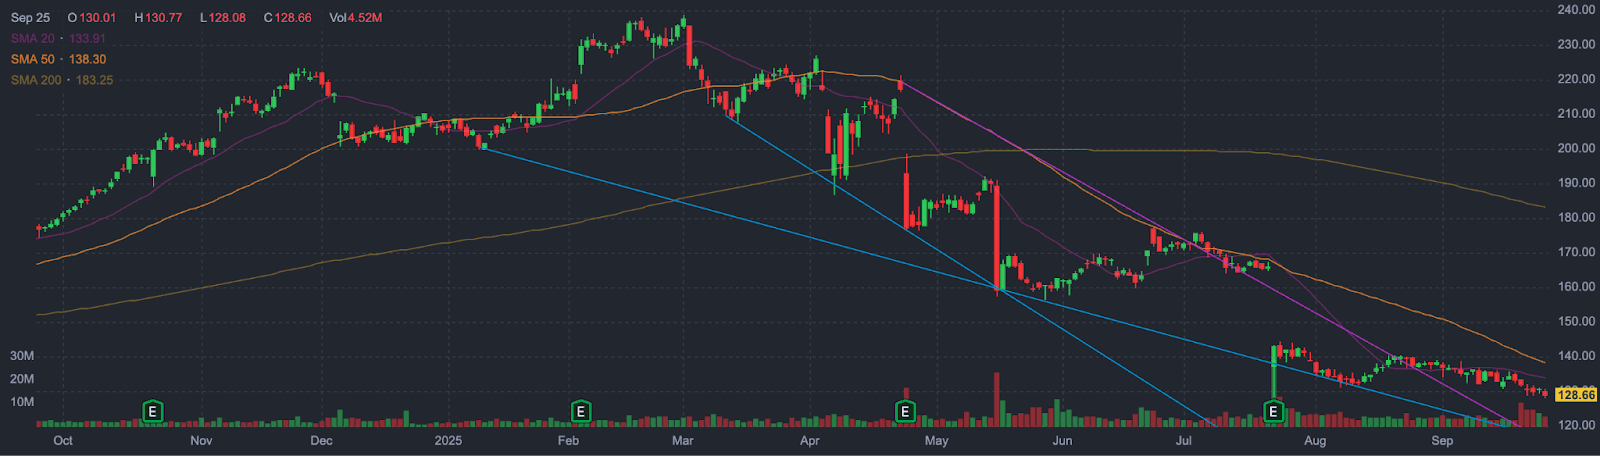
Fiserv (NYSE: FI) is trading near $129 and has continued to decline since its March highs above $230. The stock has had difficulty establishing a solid base, and the overall technical situation still shows significant downside pressure, despite some short-term efforts to stabilize.
From a trend perspective, FI is clearly in a bearish phase. It trades below the 20-day ($133.91), 50-day ($138.30), and 200-day ($183.25) SMAs, all sloping downward, which confirms ongoing selling momentum across different timeframes. Recent price movements have stayed below the 20-day average, indicating a lack of sustained buying interest.
Momentum indicators show ongoing weakness. The RSI is at 27.44, which is deep in oversold territory. This suggests that while downside momentum has been strong, the stock might be nearing exhaustion levels, where a technical rebound could happen. The MACD line (-2.60) is below the signal line (-2.48) with a slightly negative histogram (-0.1244), showing bearish momentum that has not yet indicated a reversal.
Structurally, FI has been in a clear downward channel since April, characterized by lower highs and lower lows. Attempts to build a base near $135 in August did not succeed, and the stock has moved lower, testing new year-to-date lows. Volume has remained high during down days, highlighting strong selling pressure.
Key support is at $125, a psychological and structural level. If this breaks, it could lead to a decline towards $120. On the upside, the first resistance point is near $135, followed by the 50-day SMA around $138. A stronger barrier is at $150, where the stock would need to break the channel pattern to indicate meaningful stabilization.
Fiserv is in a technically weak position, with downward-moving averages and momentum indicators signaling ongoing selling pressure. While oversold conditions increase the chance of a short-term bounce, the stock must regain at least the $138-$150 range to shift the longer-term outlook away from its persistent bearish trend.
Pfizer, Inc. - PFE - AI Score : 88.66
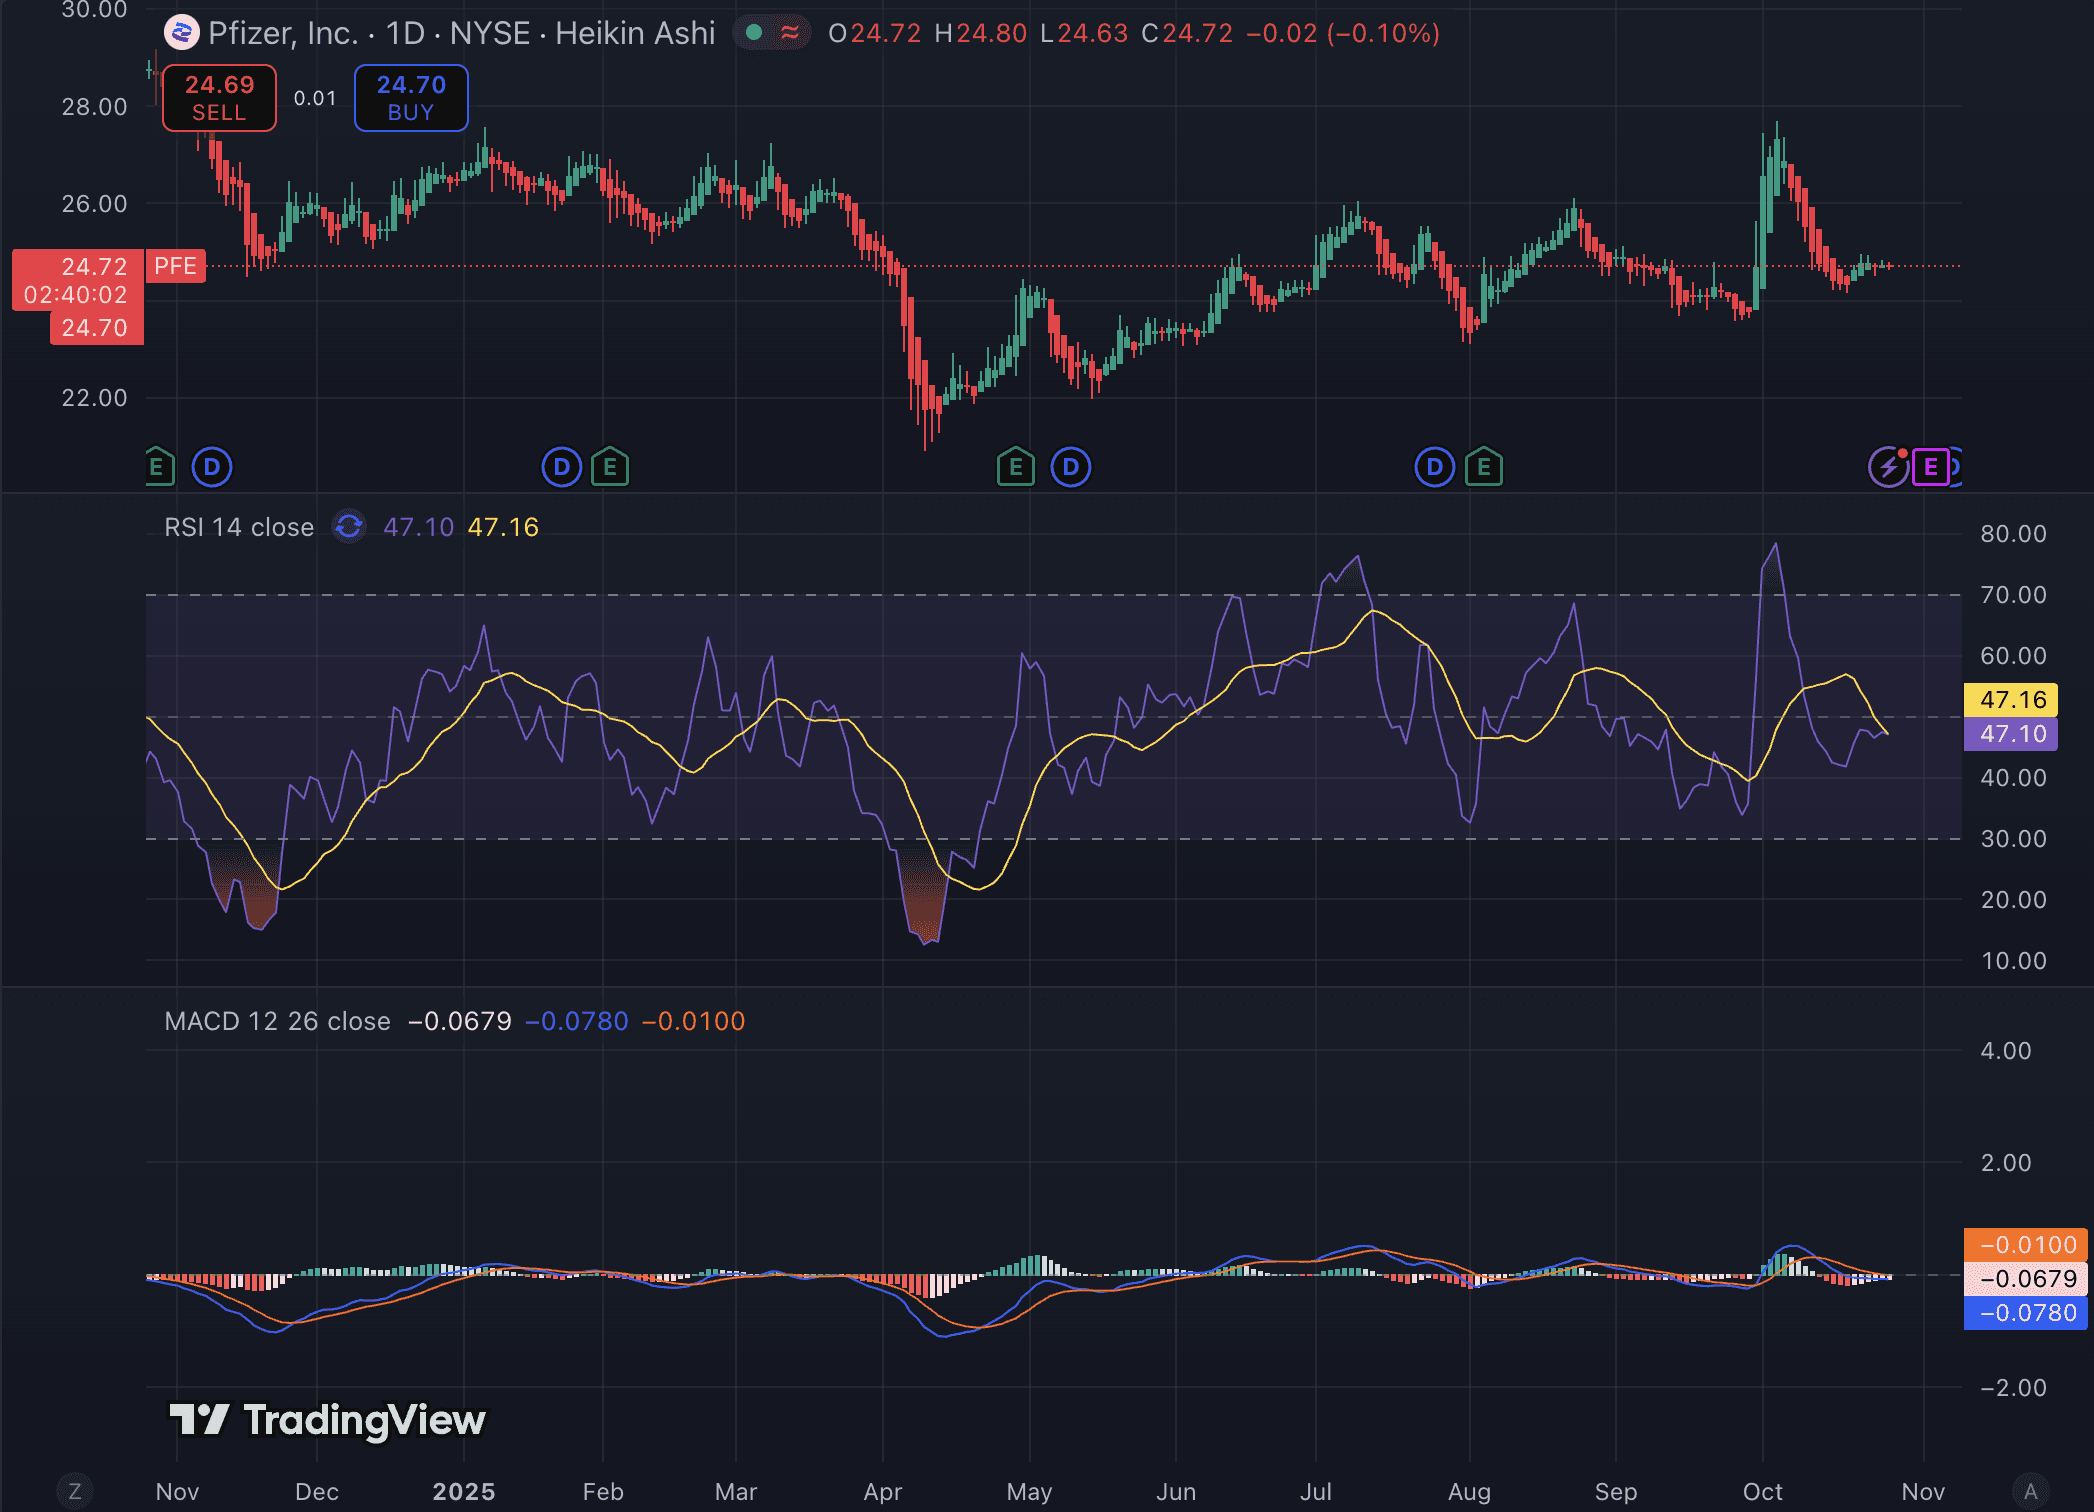
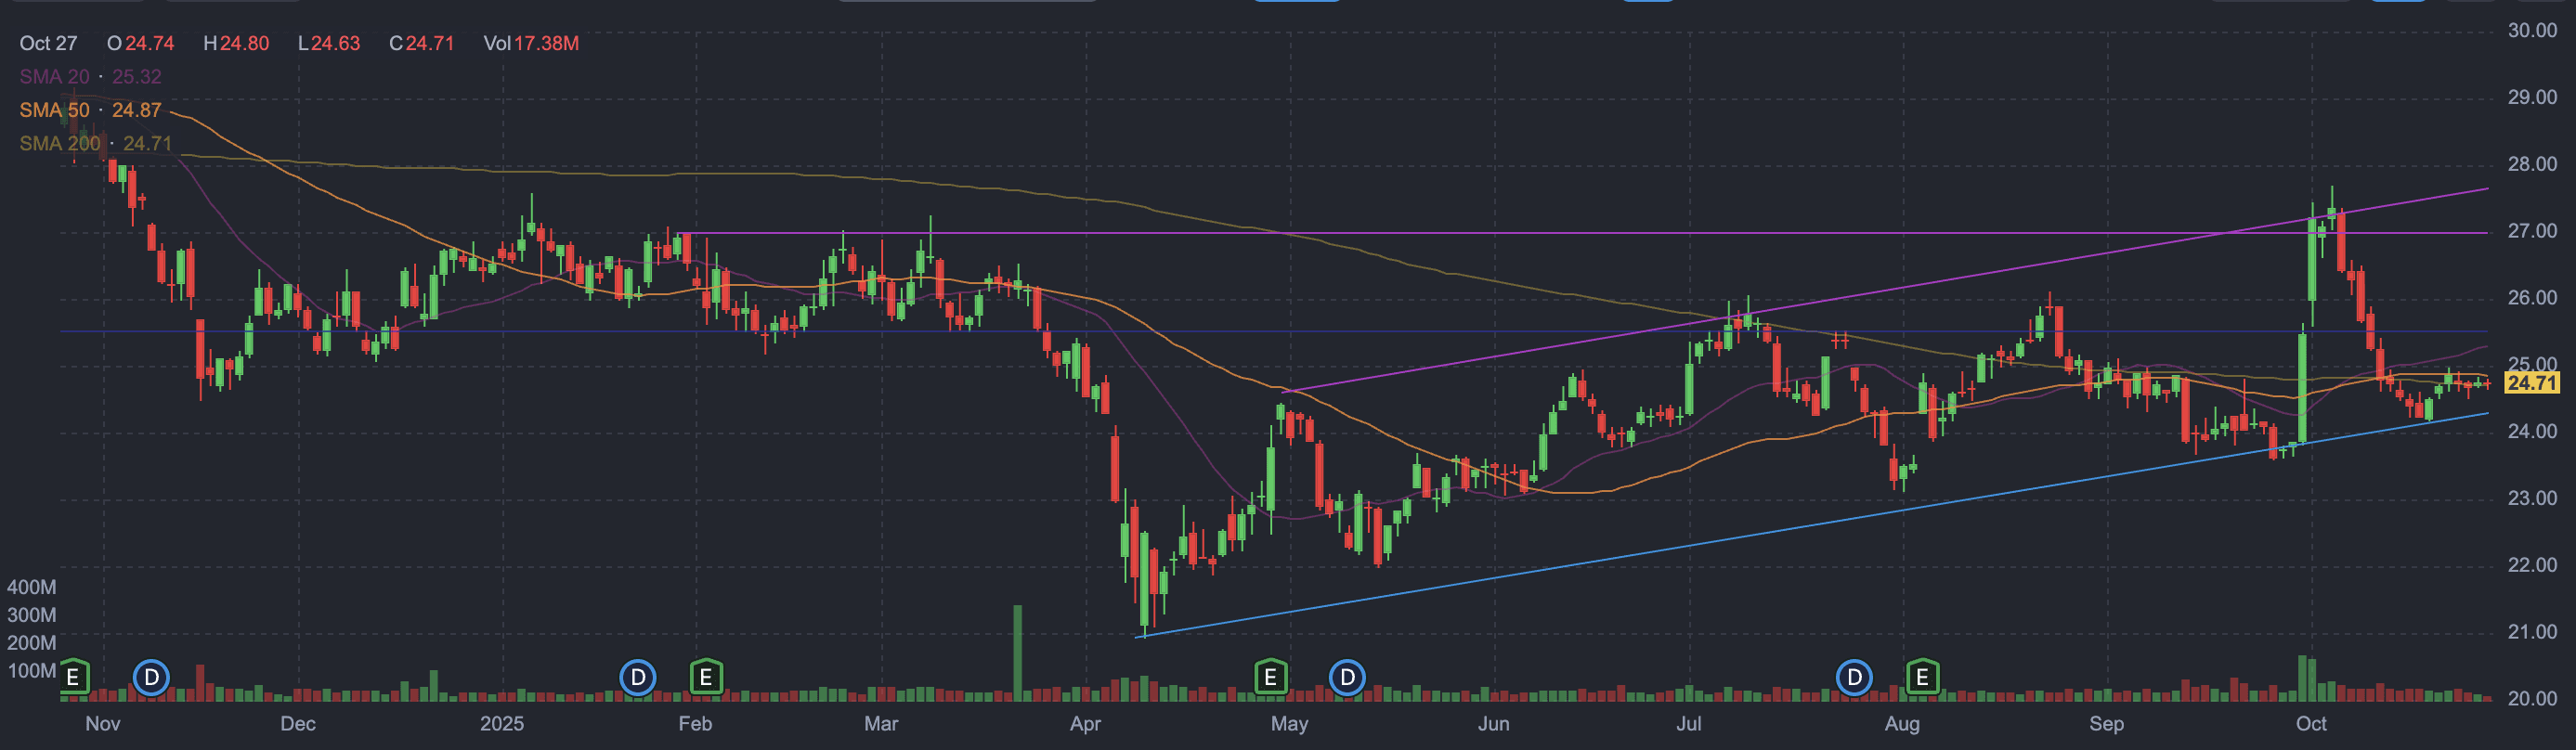
Pfizer (NYSE: PFE) is trading near $24.71, moving sideways after its early-October rebound stalled around the $27 level. The stock remains in a prolonged consolidation phase following a multi-month downtrend, as investors await clearer signs of earnings stabilization and pipeline traction.
From a trend perspective, PFE is caught between mixed moving-average signals. It trades near its 200-day SMA ($24.71), slightly below the 50-day ($24.87) and 20-day ($25.32) averages, all of which have flattened. This alignment indicates a neutral short-term bias but limited directional strength. The 200-day average, now acting as resistance, is a key level to reclaim for any sustainable bullish reversal.
Momentum indicators show indecision. The RSI sits at 47.08, hovering near neutral, reflecting a lack of strong buying conviction. The MACD line (–0.0680) is marginally below the signal line (–0.0101) with a nearly flat histogram, suggesting momentum remains subdued. There are no clear signs of accumulation, but also no heavy selling pressure at this stage.
Structurally, PFE continues to hold above its rising support trendline from April, indicating that buyers are still defending the lower boundary around $24. However, repeated failures to sustain moves above $26.50–$27 have reinforced resistance along that band. Price compression between this resistance zone and the uptrend support suggests a breakout is nearing in either direction. Volume remains moderate, consistent with consolidation behavior.
Key levels to watch: immediate support at $24, followed by stronger support at $23, which coincides with prior spring lows. On the upside, resistance lies at $25.50–$26.50, then $27, which must be cleared for a meaningful shift back to bullish momentum. A confirmed move above $27 could open the way toward the $29–$30 range.
Pfizer remains technically neutral, trading near long-term equilibrium after a lengthy decline. The price structure shows stabilization, but momentum and averages suggest caution. Holding the $24 level is critical for maintaining the current base, while a decisive break above $27 would mark the first technical step toward a sustained recovery.
Cardinal Health - CAH - AI Score : 87.52
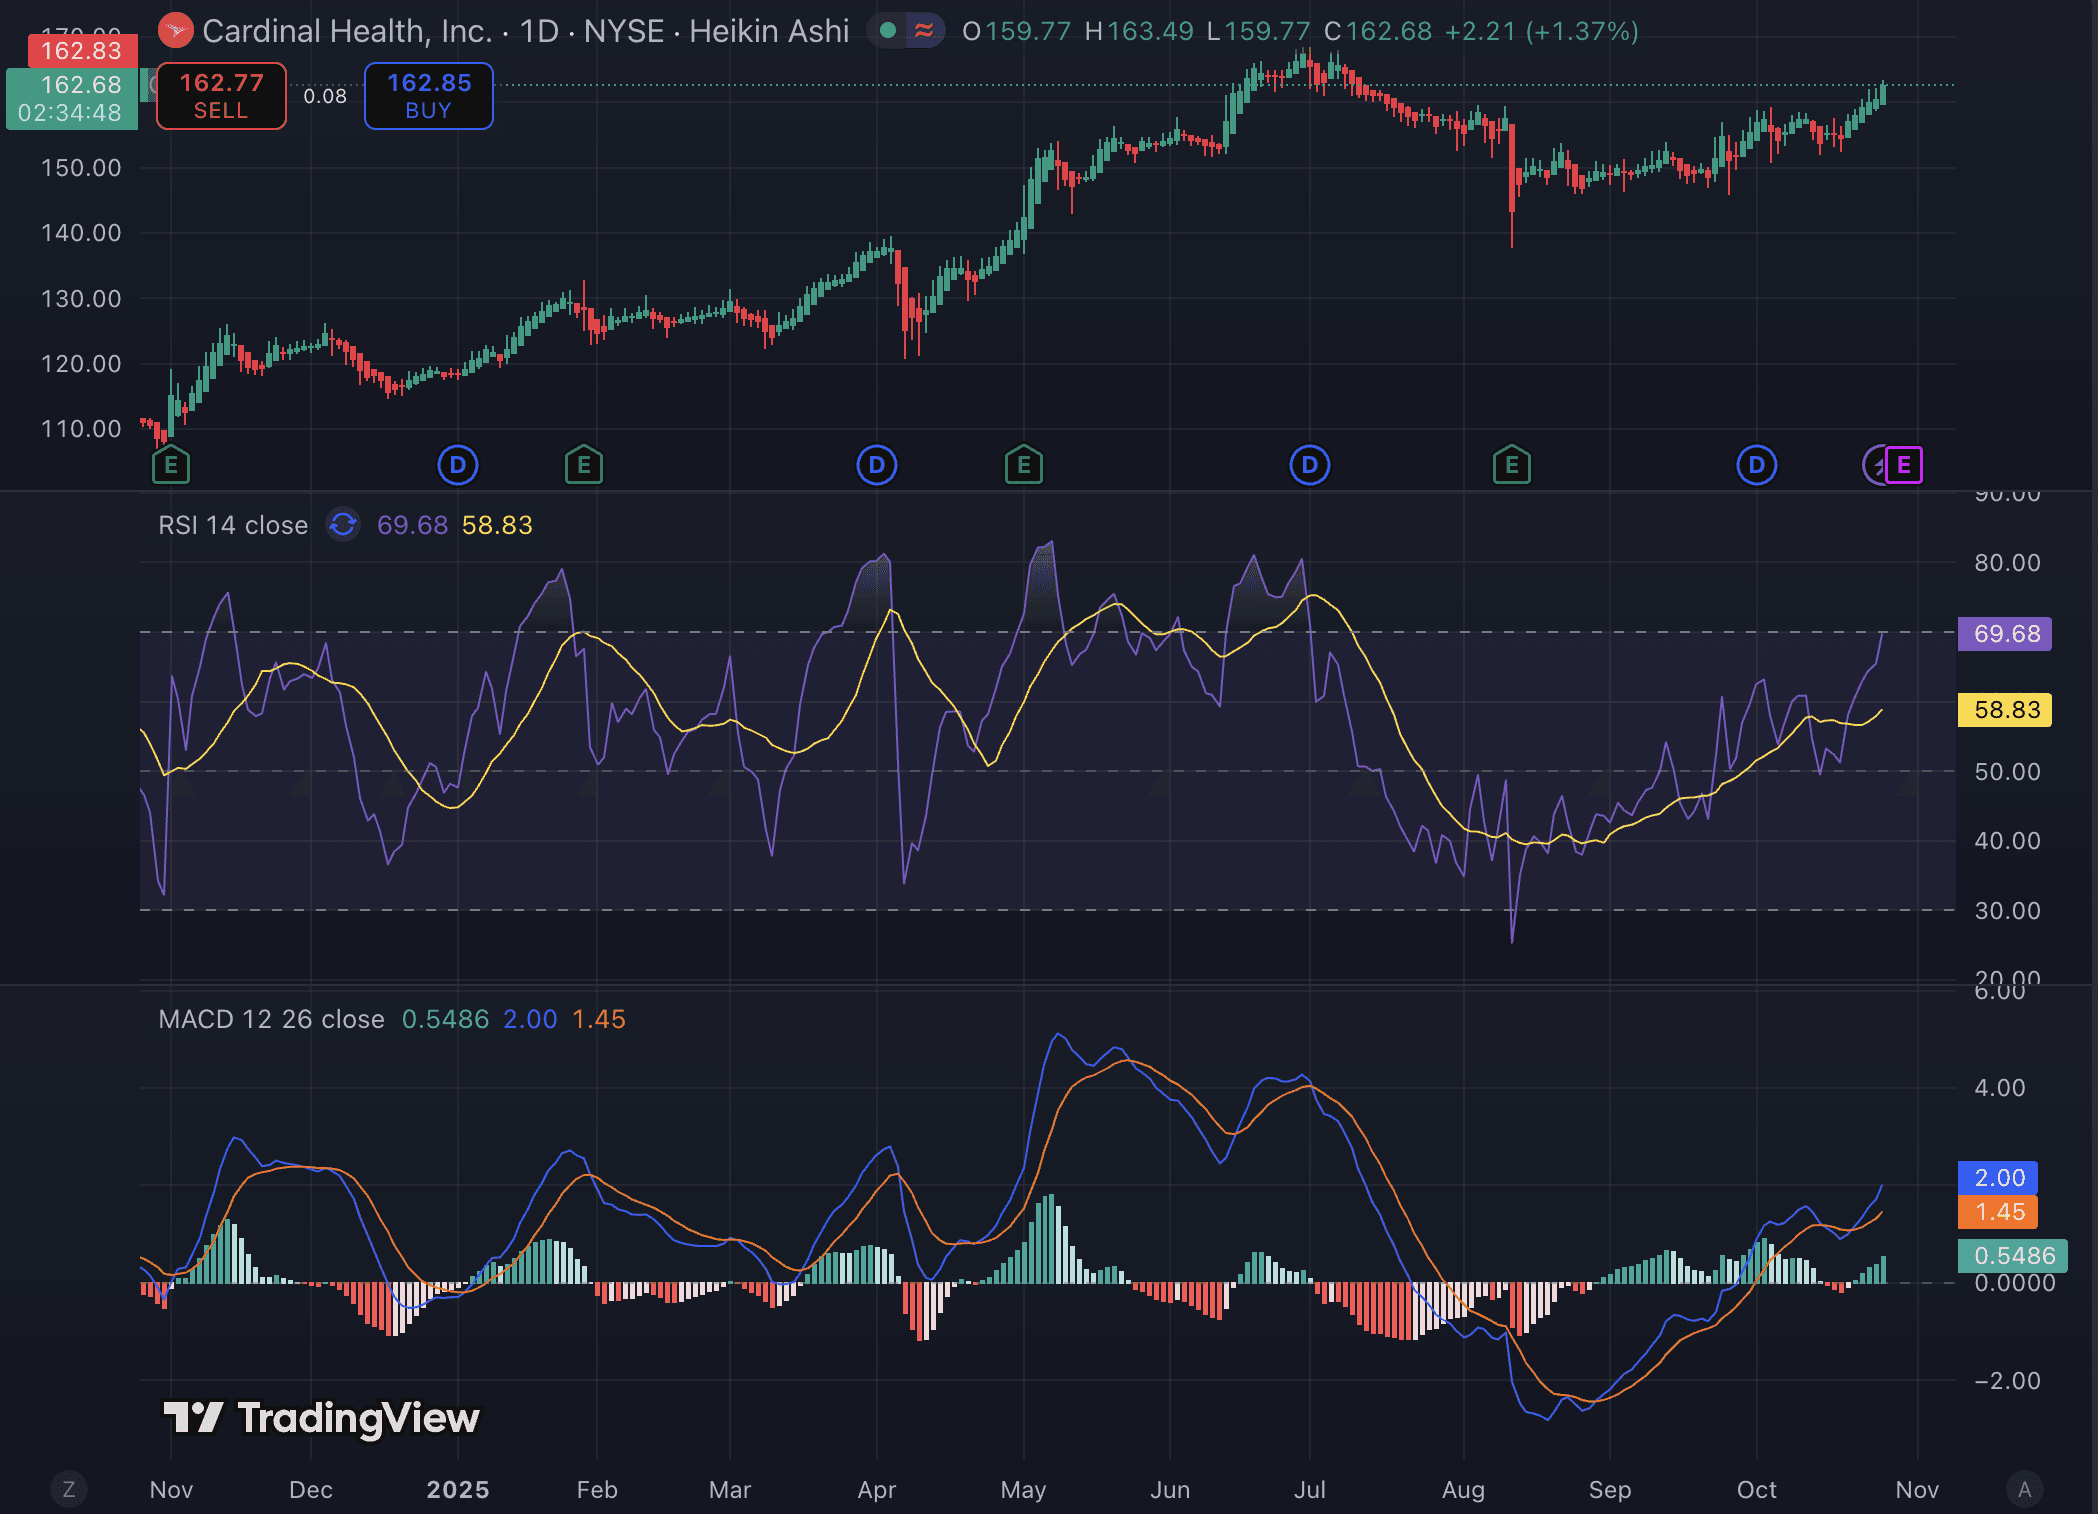
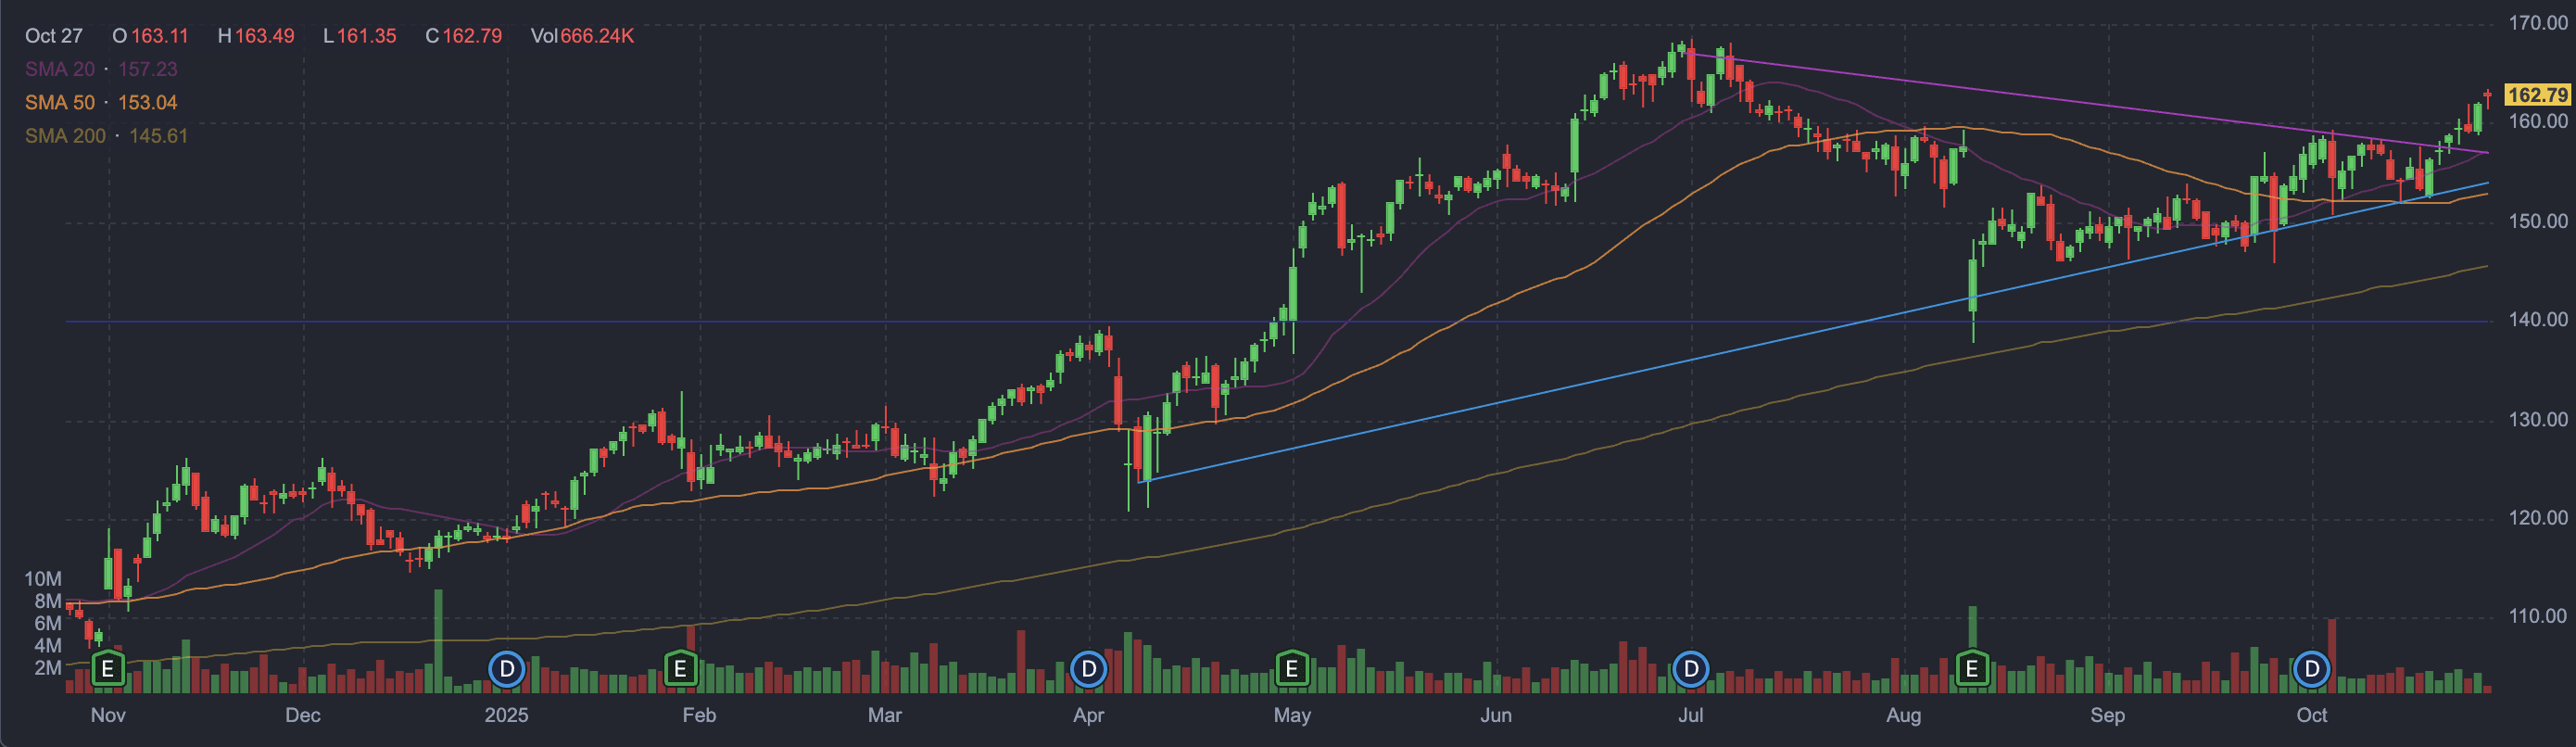
Cardinal Health (NYSE: CAH) is trading near $162.78, marking a strong breakout from its recent consolidation range. The stock has been gradually strengthening through October, supported by rising momentum and a constructive technical structure.
From a trend perspective, CAH is firmly bullish. It trades above its 20-day ($157.23), 50-day ($153.04), and 200-day ($145.61) SMAs — all of which are upward-sloping. This alignment confirms a positive setup across short-, medium-, and long-term timeframes. The breakout above descending resistance from July further reinforces the bullish tone, suggesting the potential for a sustained upward move if volume continues to support price action.
Momentum indicators back this strength. The RSI stands at 69.71, approaching overbought territory, which reflects strong buying pressure. However, this also signals a possible short-term cooling period if the stock extends too quickly. The MACD line (2.00) remains above the signal line (1.45) with a positive histogram (+0.5497), confirming steady bullish momentum and reinforcing the case for continuation.
Structurally, CAH has broken out of a symmetrical triangle pattern formed since July, supported by an ascending trendline from May. This structure reflects a coiling phase now resolving upward. The breakout above the $160 level was decisive, accompanied by modestly higher trading volume, which validates the move. The next significant resistance sits near the prior high at $165–$167, while the uptrend remains intact as long as price holds above $155–$157.
Key levels to watch: on the upside, $165 is immediate resistance, followed by $170 if momentum persists. On the downside, near-term support lies around $157 (20-day SMA), with stronger support at $153 (50-day SMA). A close below $150 would weaken the short-term trend but leave the longer-term structure intact above the 200-day.
Cardinal Health remains technically strong, with moving averages aligned positively and momentum indicators supporting the advance. While overbought signals suggest potential short-term pauses, the broader setup favors continuation higher as long as the stock holds above $155. Sustained strength above $165 would confirm a fresh leg in CAH’s ongoing uptrend.
GE Aerospace - GE - AI Score : 87.51
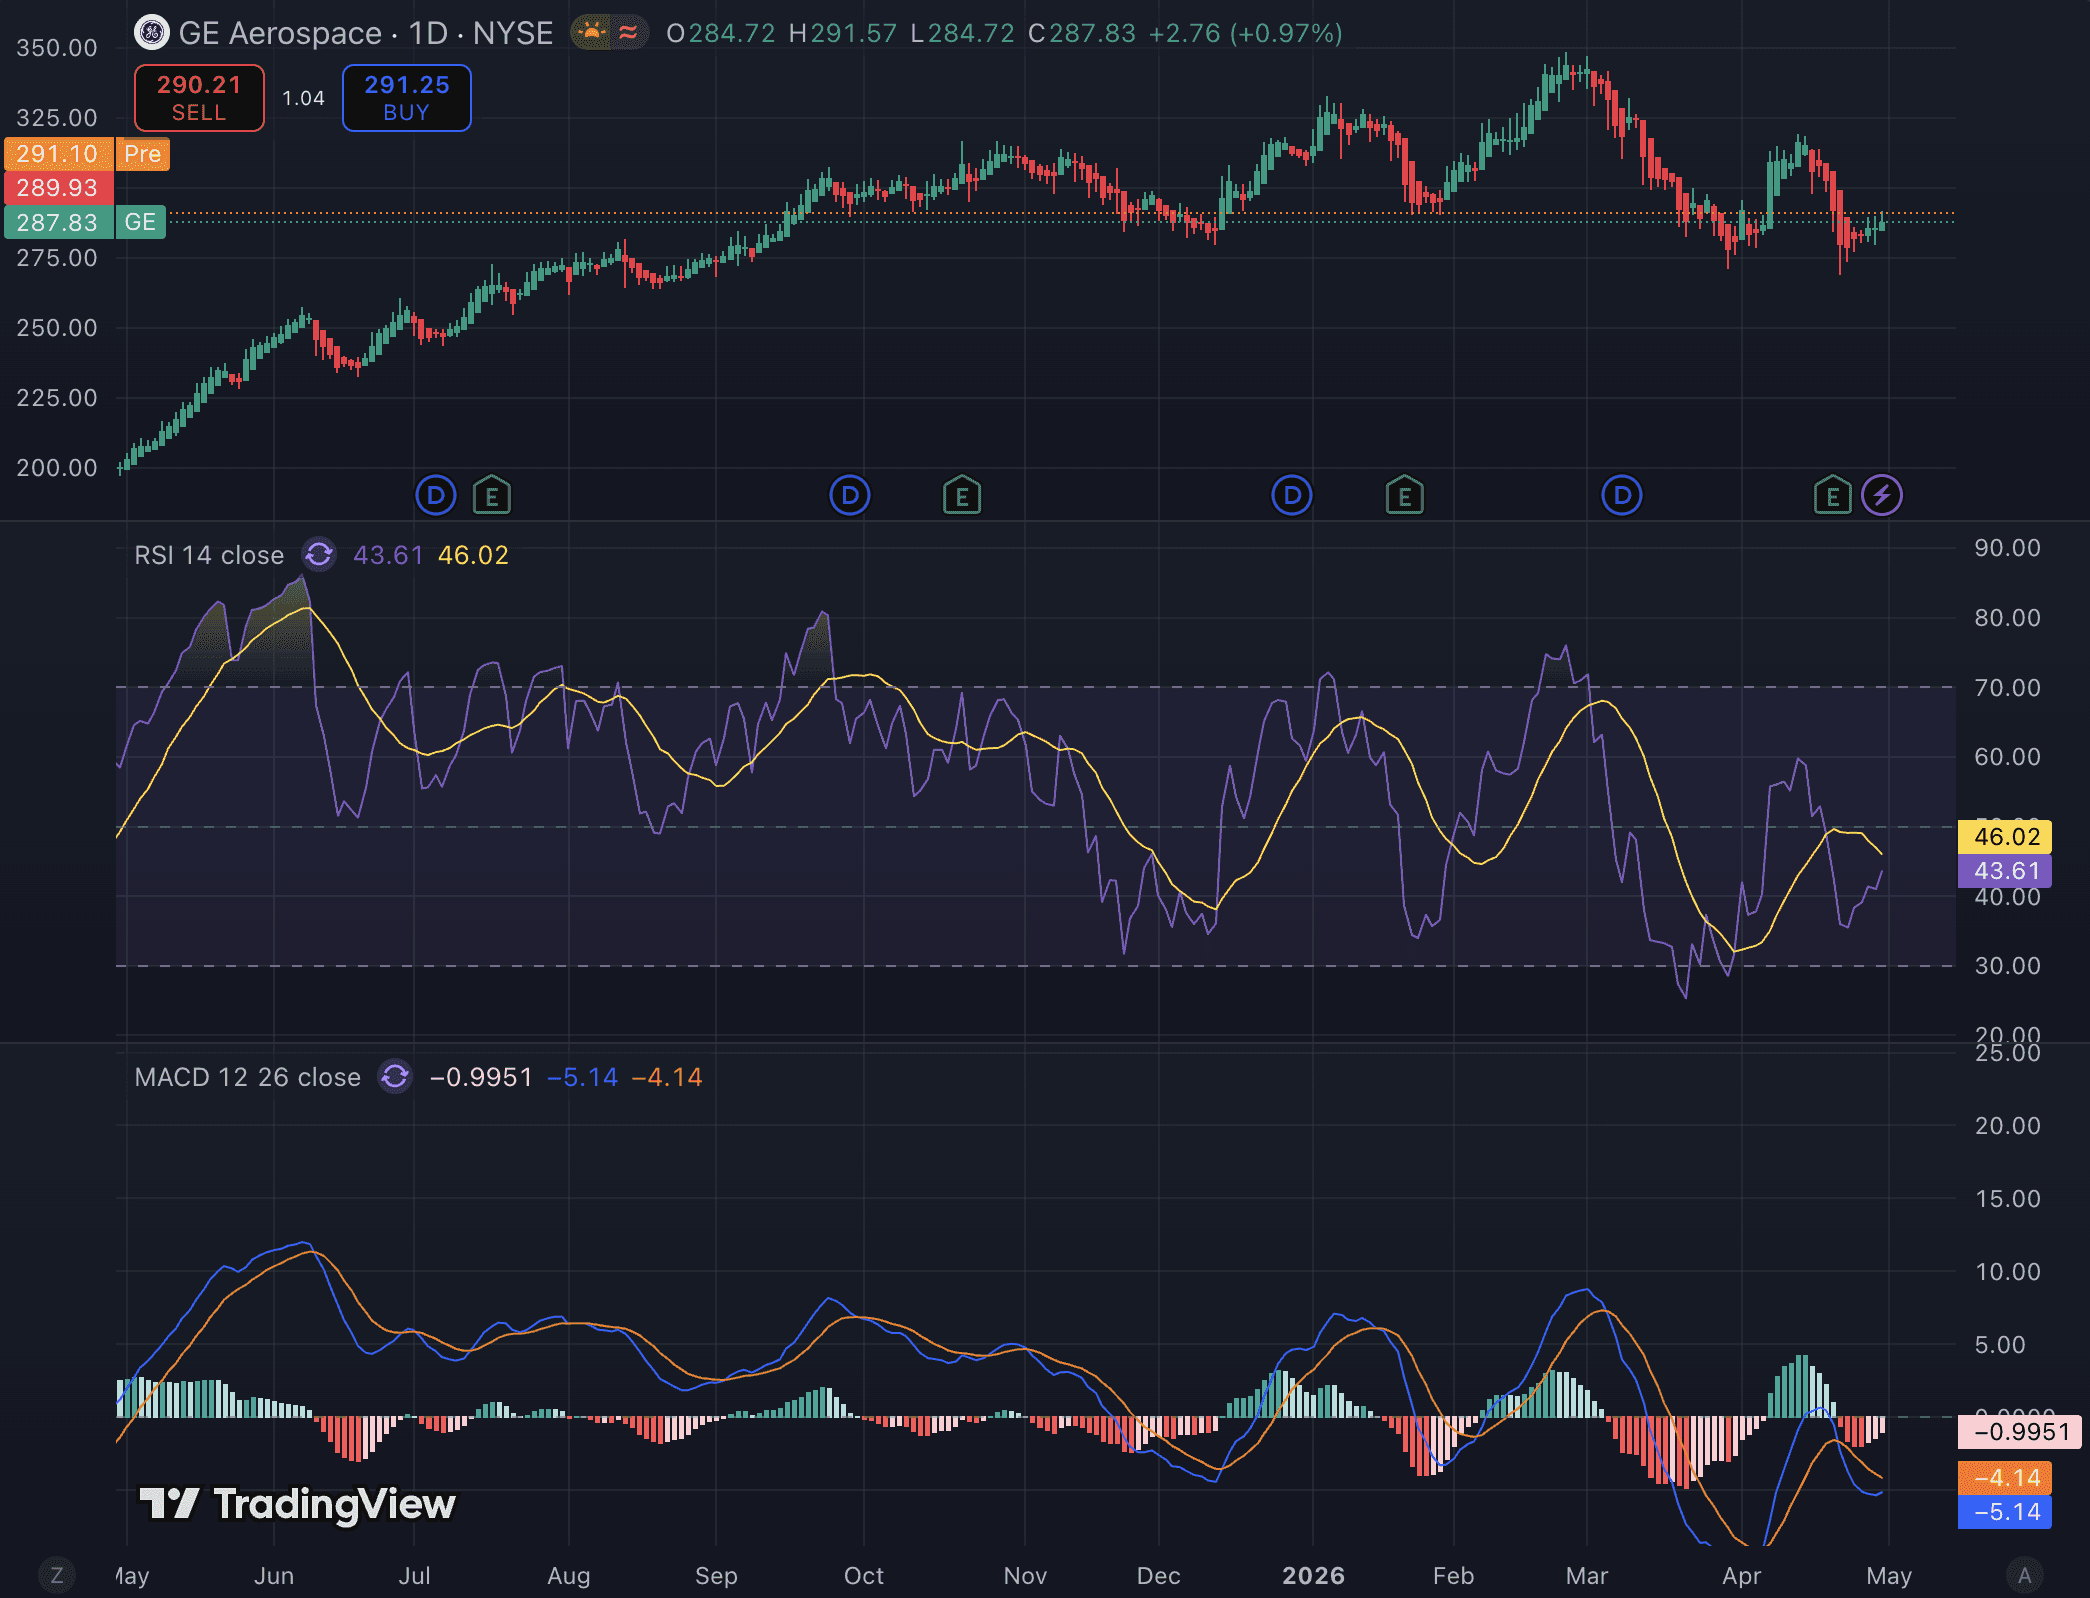
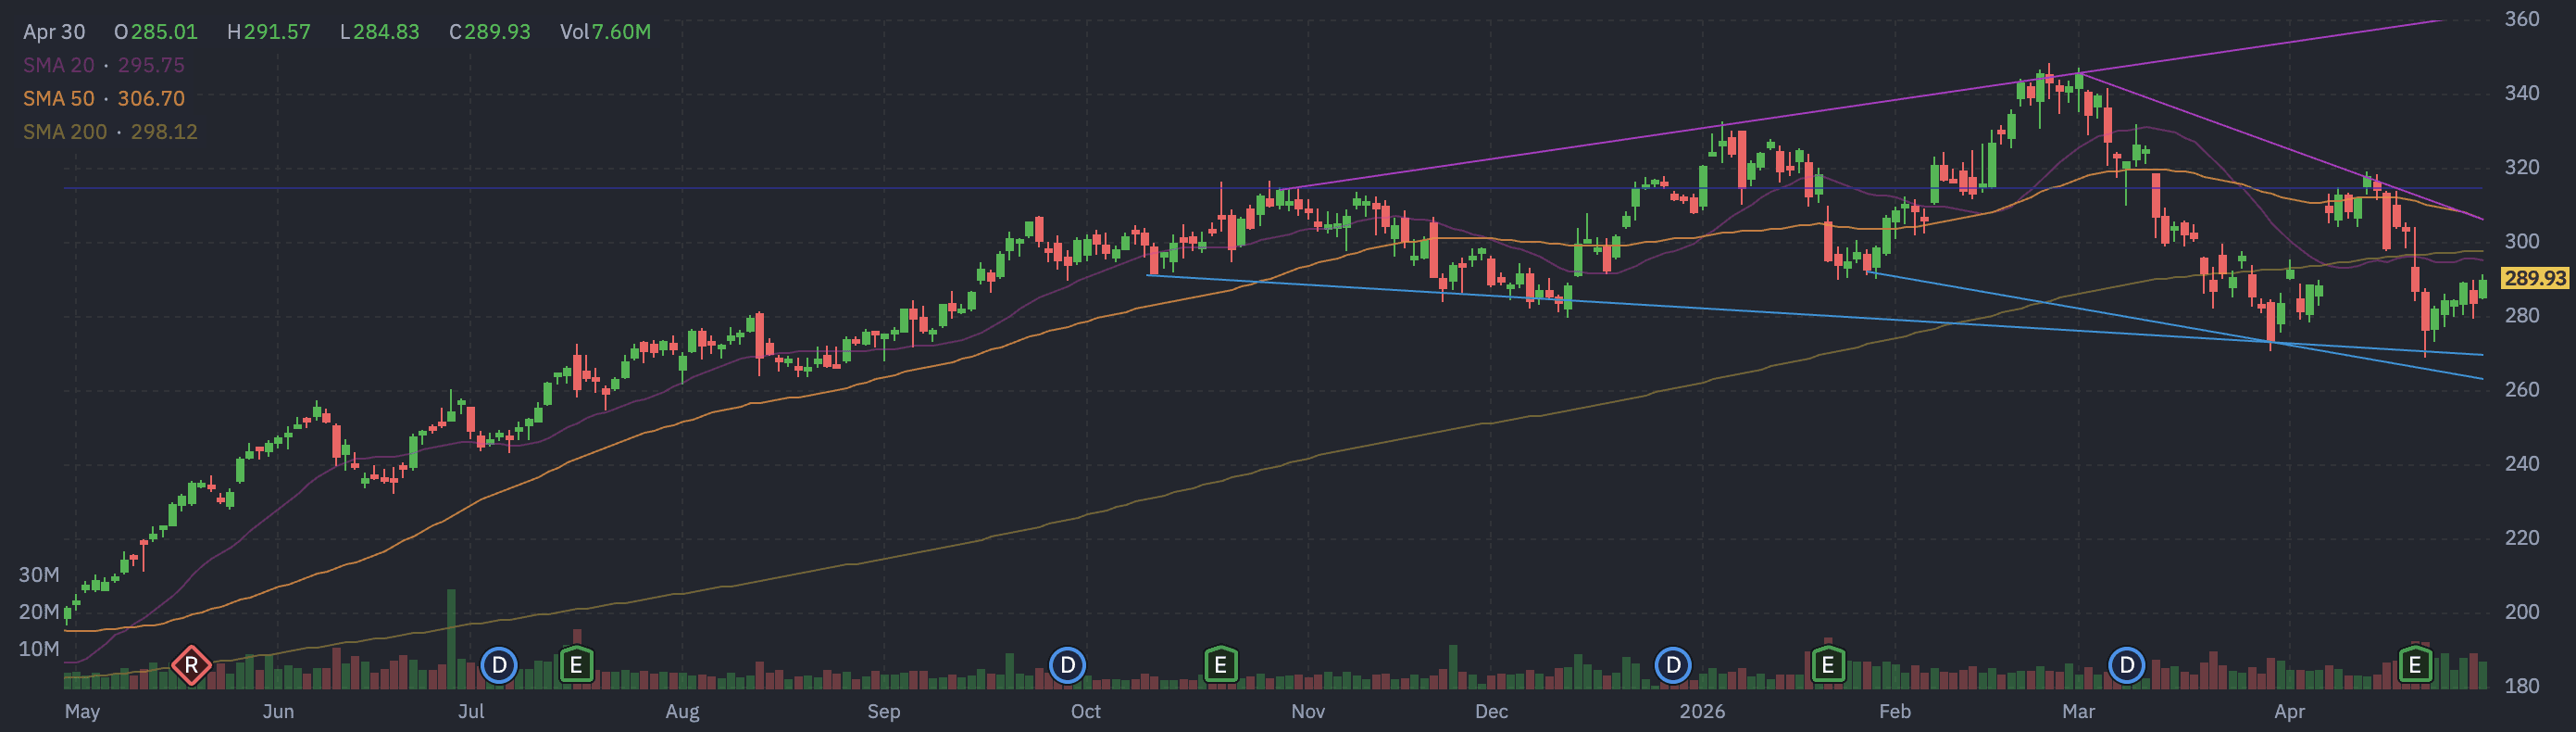
GE Aerospace (GE) is currently trading around $289.93, recovering off recent lows after a prolonged corrective phase that brought the stock down from its peak near $350 in late 2025. The price action over the past several months has formed a descending wedge or falling channel structure, with a series of lower highs compressing against a rising support trendline that originates from the broader uptrend established since mid-2025. The April selloff tested the lower boundary of this structure aggressively, but the stock has responded with a sharp recovery candle, closing near $289.93 on volume of 7.60 million shares, suggesting the support zone is being defended.
From a trend perspective, the moving average picture reflects the damage done during the corrective phase but is beginning to show early signs of stabilization. The stock is currently trading below the 20-day SMA at $295.75, below the 50-day SMA at $306.70, and below the 200-day SMA at $298.12. All three averages are negatively stacked, which is technically unfavorable, though the proximity of the 200-day and 20-day SMAs in the $295 to $298 range creates a meaningful cluster of resistance directly overhead. A reclaim of this zone would represent the first meaningful shift in the moving average structure and is the key near-term technical hurdle.
Momentum indicators are beginning to show tentative signs of recovery from oversold conditions. The RSI is currently reading 43.61 on the faster line and 46.02 on the smoothed line, both sitting below the 50 midline but trending upward off the lows that were established during the April trough. This configuration is consistent with a stock attempting to base and recover rather than one in active breakdown. The RSI dipped toward the low 30s during the April selloff, which matched the oversold readings last seen at prior corrective lows, and the current upturn from that level is a mild positive divergence in momentum. On the MACD, the MACD line sits at -5.14 and the signal line at -4.14, placing the histogram at -0.9951. Both lines remain deeply in negative territory, but the histogram is contracting from its most negative readings, indicating that downside momentum is beginning to exhaust. A bullish crossover of the MACD line above the signal line would be an important confirmation signal for any near-term recovery thesis.
Structurally, the most significant feature on the chart is the falling wedge formation visible on the second chart, bounded by descending resistance from the November 2025 highs near $350 and rising support connecting the October and April lows. Price appears to have tested the lower boundary of this wedge during the April selloff and has bounced sharply, which is the classic resolution setup for this pattern. The horizontal support zone near $280 to $285 represents the critical floor, as it aligns with prior consolidation from late 2025 and the structural low established during the most recent corrective leg. A break below $280 on meaningful volume would be a significant technical deterioration.
Key downside support sits at the $280 to $285 zone, with more critical structural support at the $265 to $270 area which aligns with the rising long-term trendline visible on the daily chart. On the upside, the immediate resistance cluster sits at $295 to $298 where the 20-day and 200-day SMAs converge, followed by the 50-day SMA near $306.70. A reclaim of the $306 to $310 zone would represent a meaningful technical recovery and begin to repair the moving average structure. The prior distribution zone near $340 to $350 remains the larger overhead supply area that would need to be resolved on any sustained advance.
GE Aerospace is in a technically challenged but potentially bottoming condition, with price recovering from an oversold April low within the context of a falling wedge structure. The moving average configuration remains bearish, but momentum indicators are stabilizing and the wedge support has held on the initial test. The near-term setup favors a continued recovery attempt toward the $295 to $306 resistance cluster, and a sustained reclaim of the 50-day SMA near $306.70 would be the first meaningful confirmation that the corrective phase has run its course. Any failure to hold above $280 would shift the technical outlook back to cautious and open the door toward the $265 to $270 support area.
Devon Energy Corporation - DVN - AI Score : 86.91
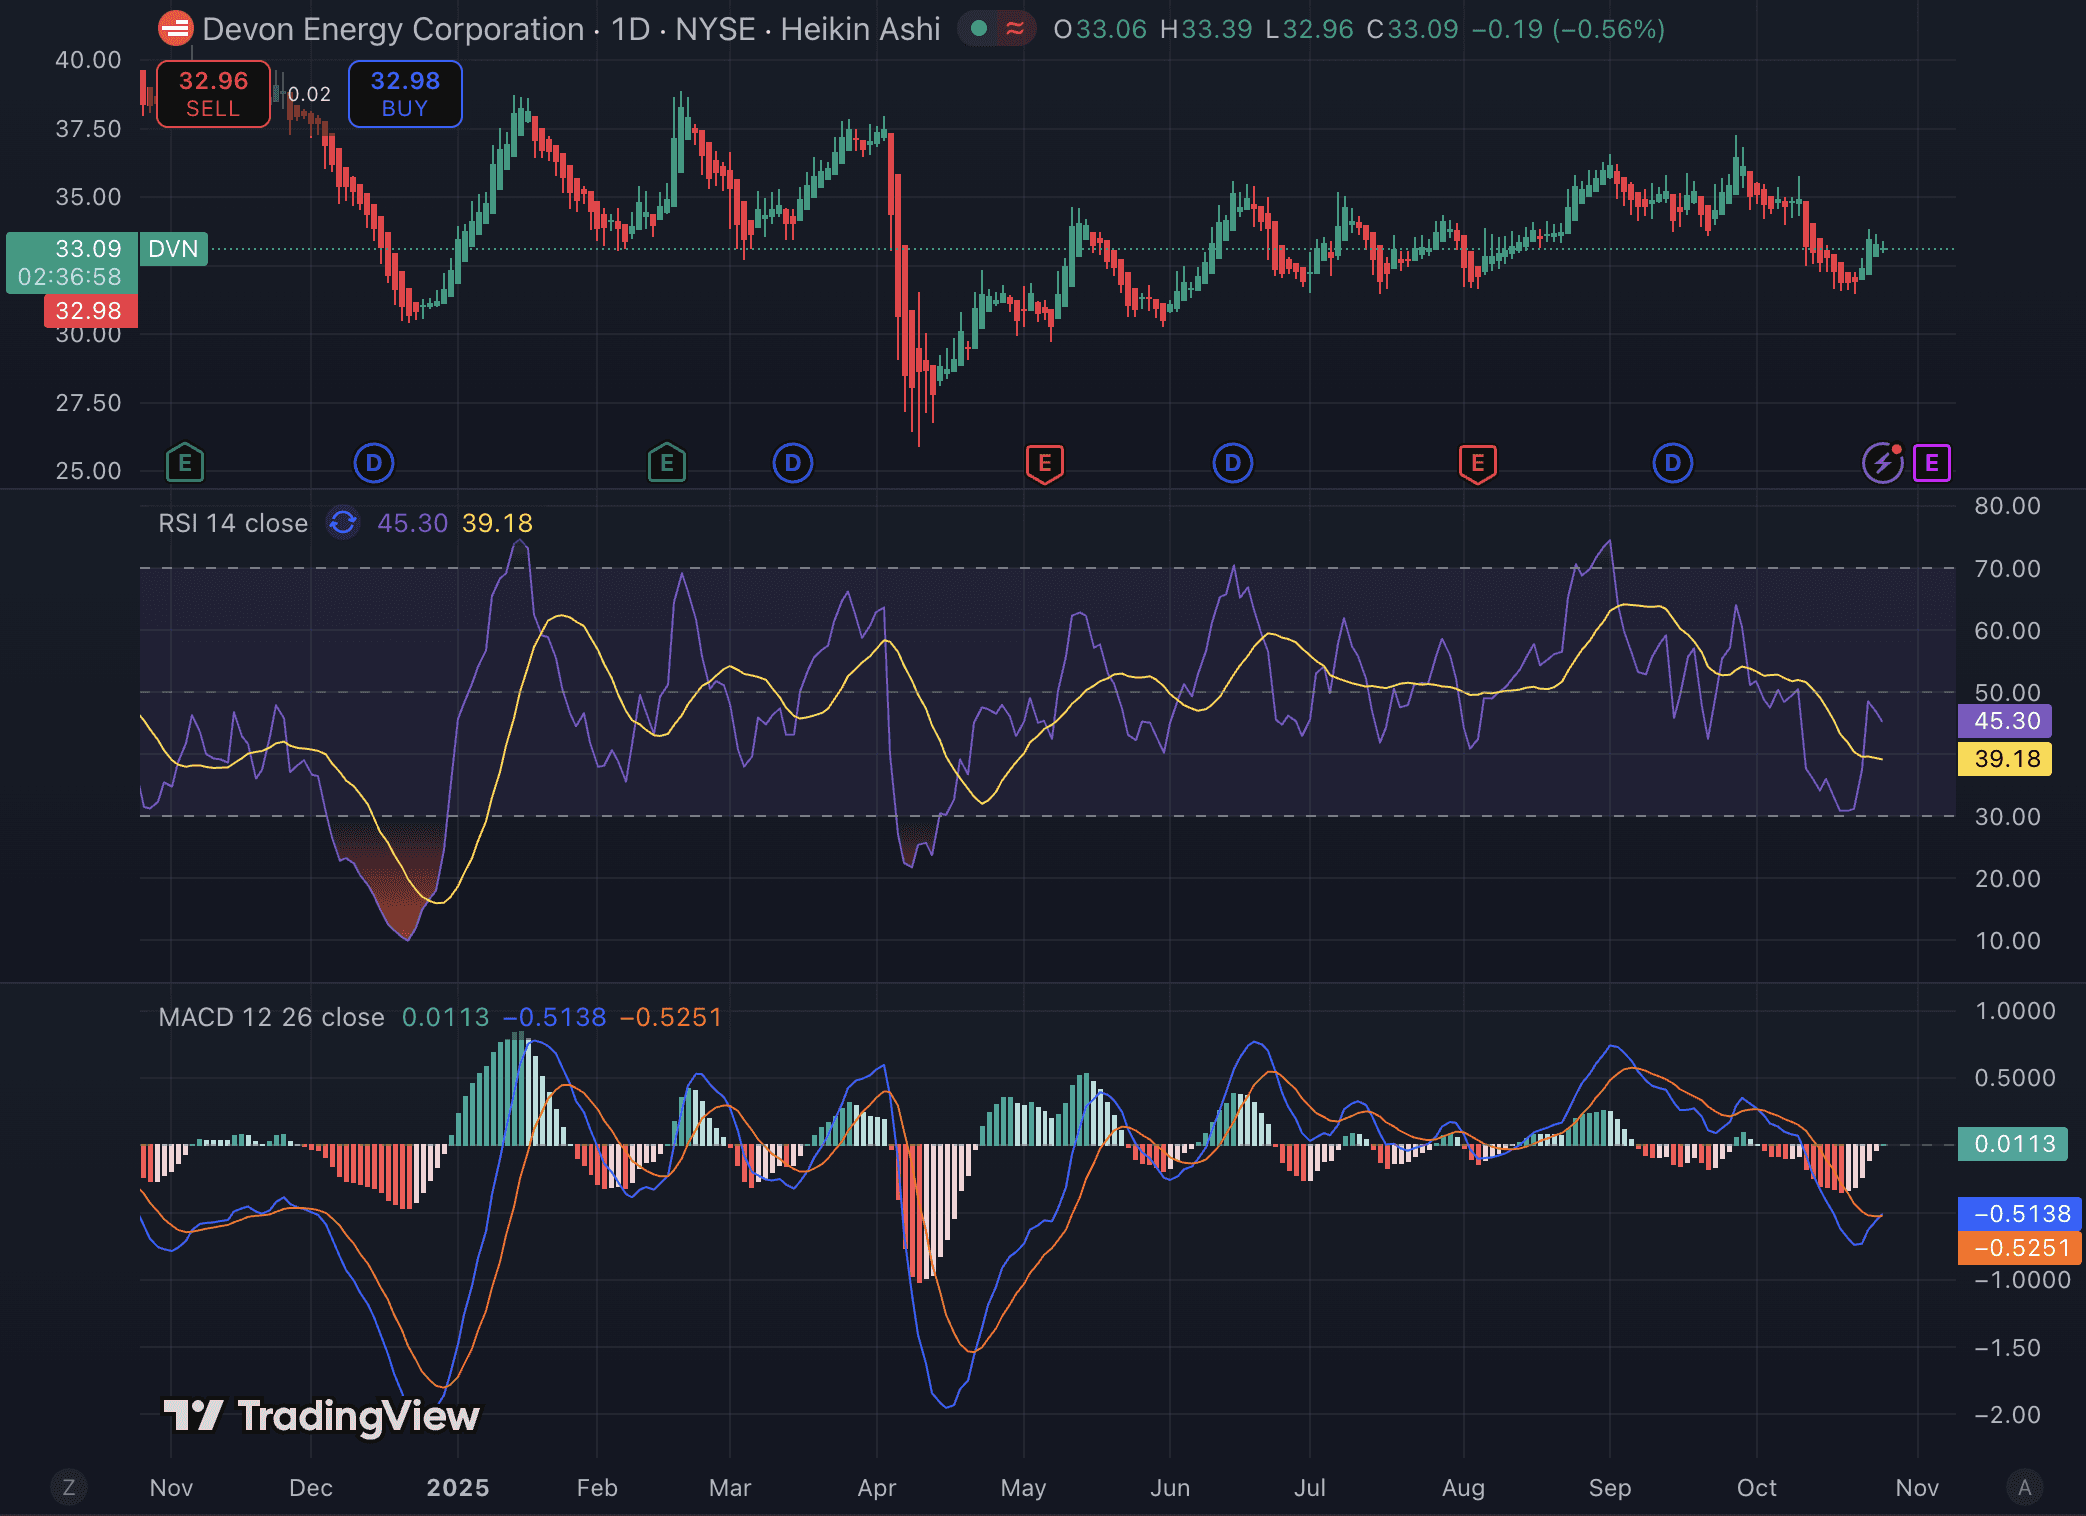
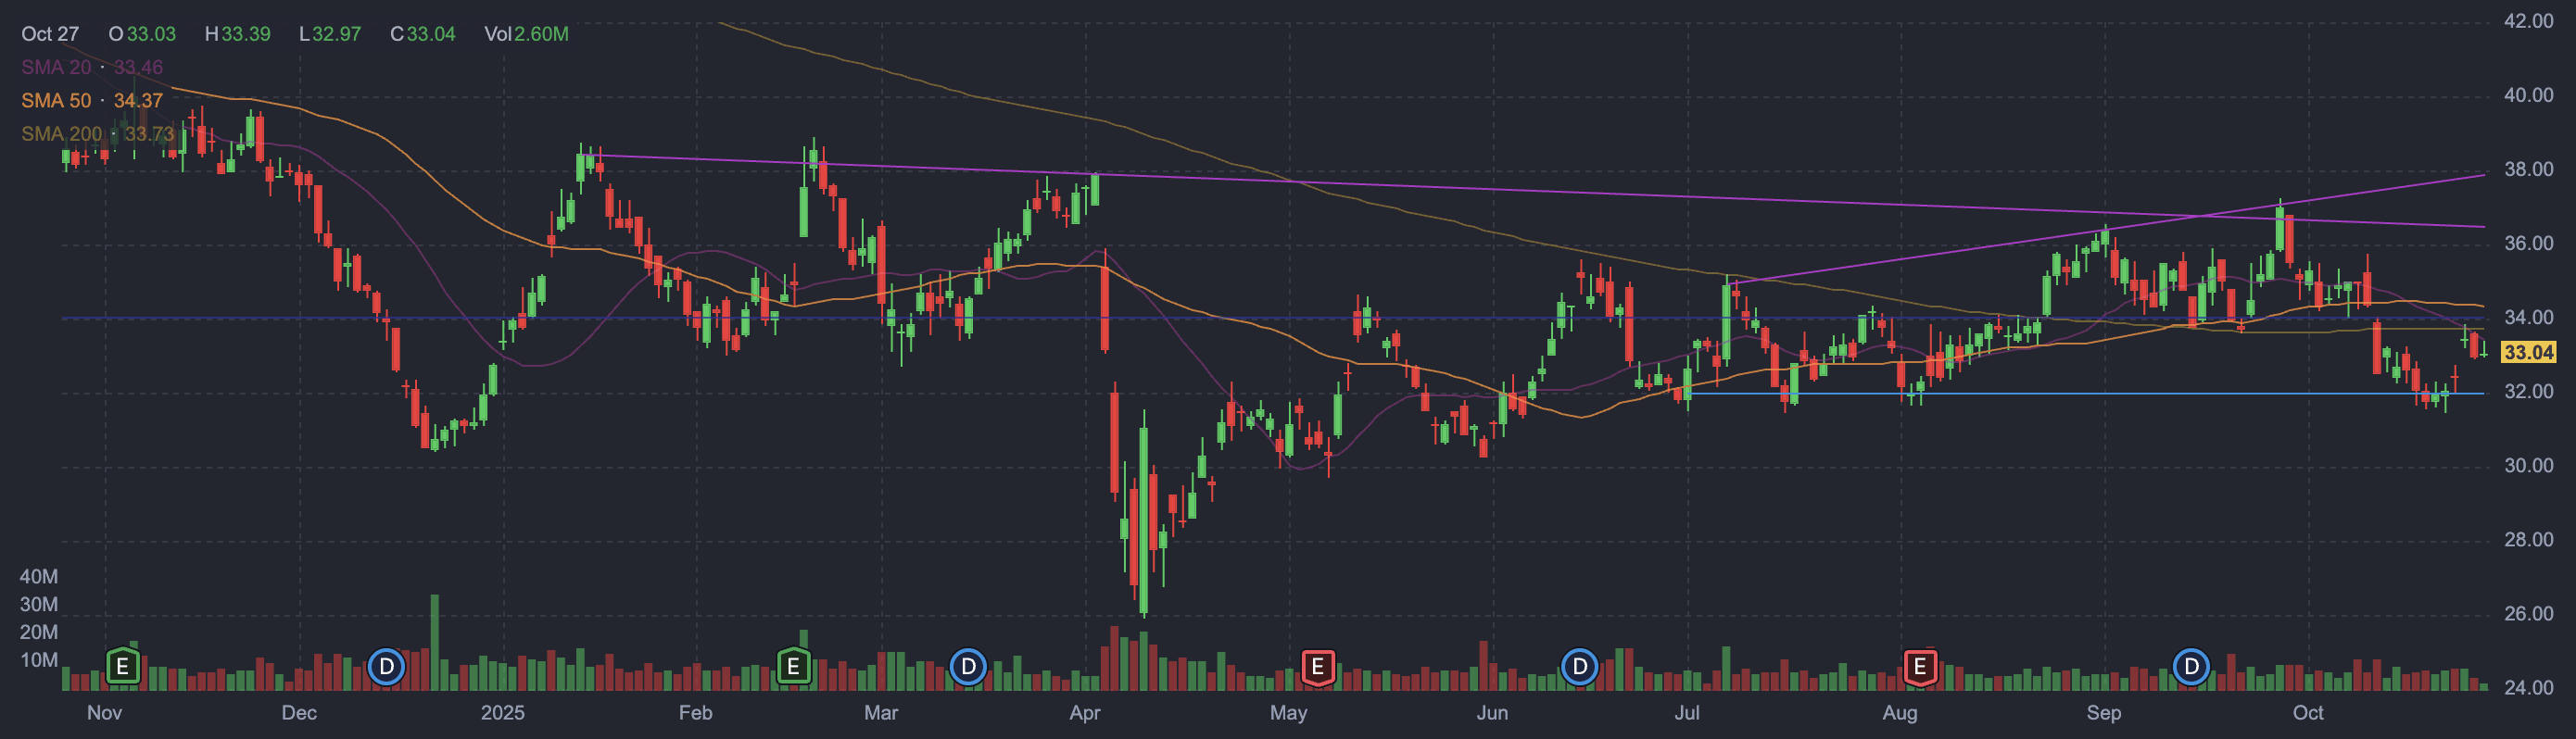
Devon Energy (NYSE: DVN) is trading near $33.09, struggling to regain momentum after retreating from its late-summer highs around $37. The stock has been consolidating near key support levels, as energy prices remain volatile and investor sentiment toward the sector softens.
From a trend perspective, DVN is positioned in a neutral-to-bearish zone. It trades below the 20-day ($33.46) and 50-day ($34.37) SMAs, while hovering slightly below the 200-day ($33.73). This close alignment of the moving averages highlights ongoing indecision, with no clear directional bias. A sustained move above the 200-day SMA would be needed to reestablish a constructive technical outlook.
Momentum indicators reflect weak but stabilizing conditions. The RSI is at 45.27, suggesting that DVN has exited oversold territory but still lacks strong buying conviction. The MACD line (0.0111) has just crossed slightly above the signal line (–0.5141), creating a small positive histogram — an early sign that downside momentum may be fading.
Structurally, the stock has been moving within a broad horizontal range since May, with multiple rejections near $36–$37 and solid support emerging around $32–$32.50. This base has been repeatedly defended, indicating accumulation at lower levels. The longer-term trendline from December 2024 lows remains intact, providing a foundation for potential recovery if energy prices stabilize or strengthen.
Key levels to watch: near-term support at $32.50, followed by $31.50 if selling pressure resumes. On the upside, resistance lies at $34, with a stronger barrier at $36–$37, where multiple moving averages and a descending trendline converge. A breakout above $37 would mark a meaningful shift toward renewed bullish momentum.
Devon Energy remains in consolidation, trading near equilibrium after a corrective phase. While short-term technicals remain subdued, the alignment of support near $32 and early MACD improvement suggest downside exhaustion. A move above $34–$35 would be the first signal that buying momentum is returning, setting the stage for a potential rebound in the weeks ahead.
Elevance Health - ELV - AI Score : 85.96
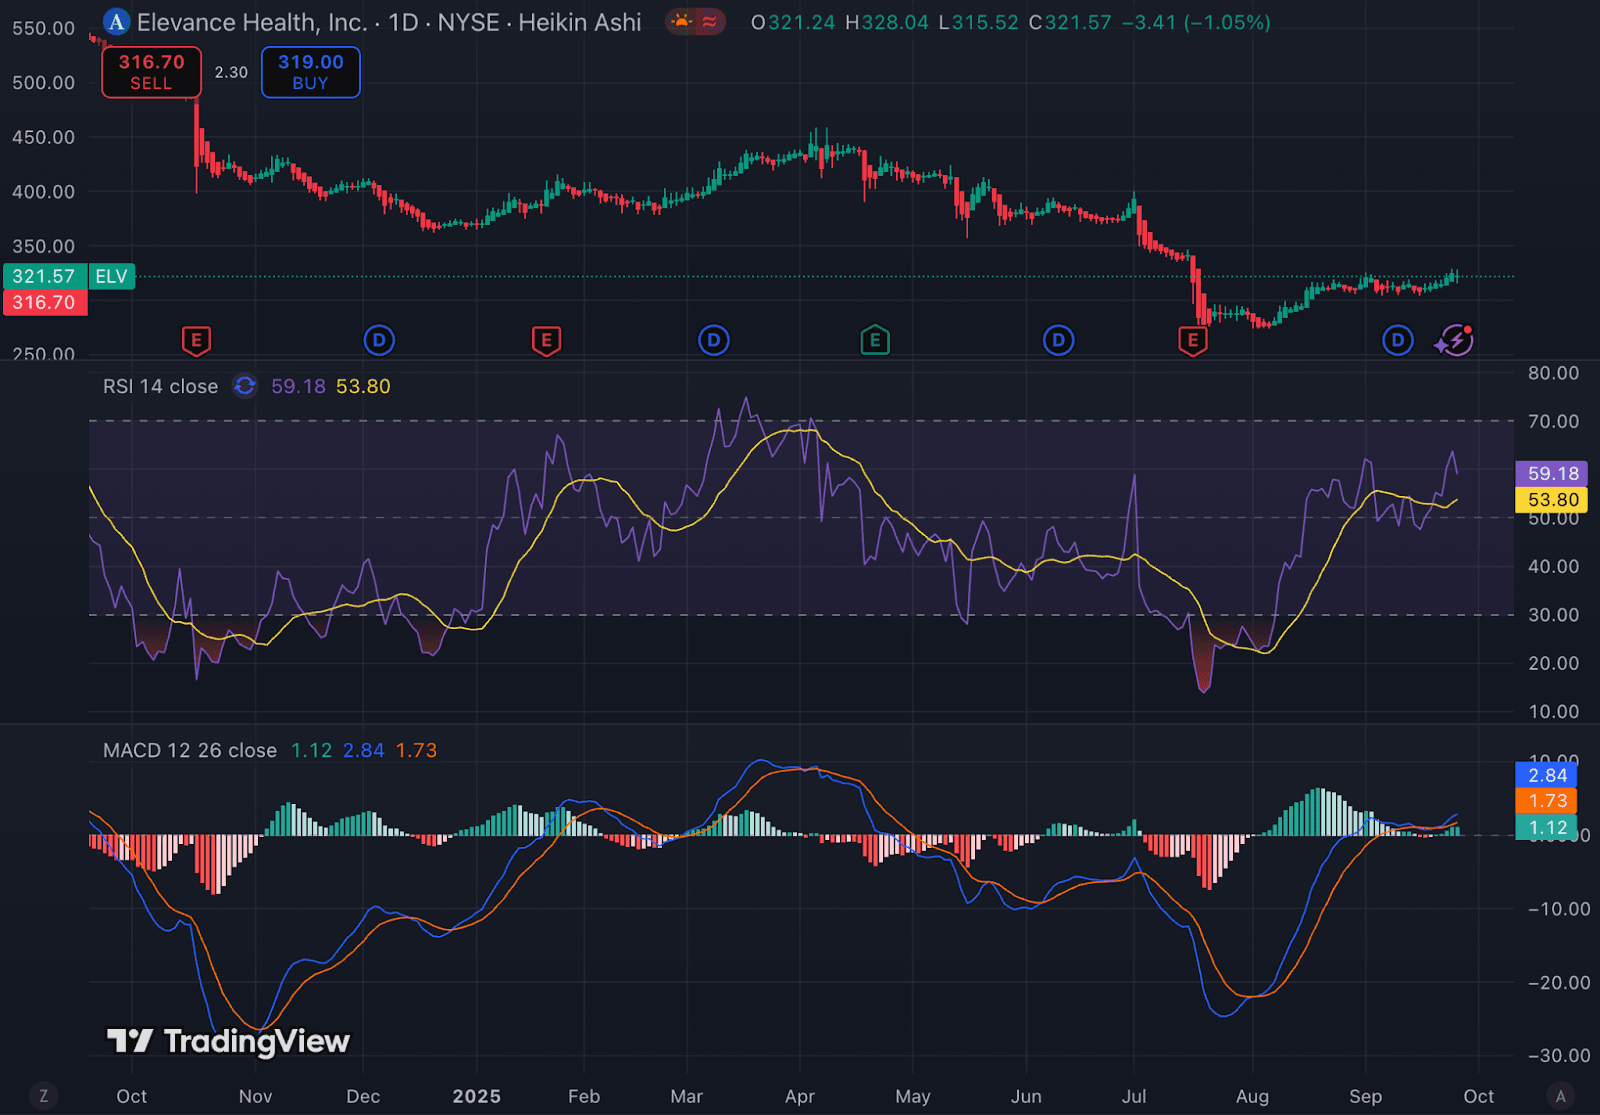
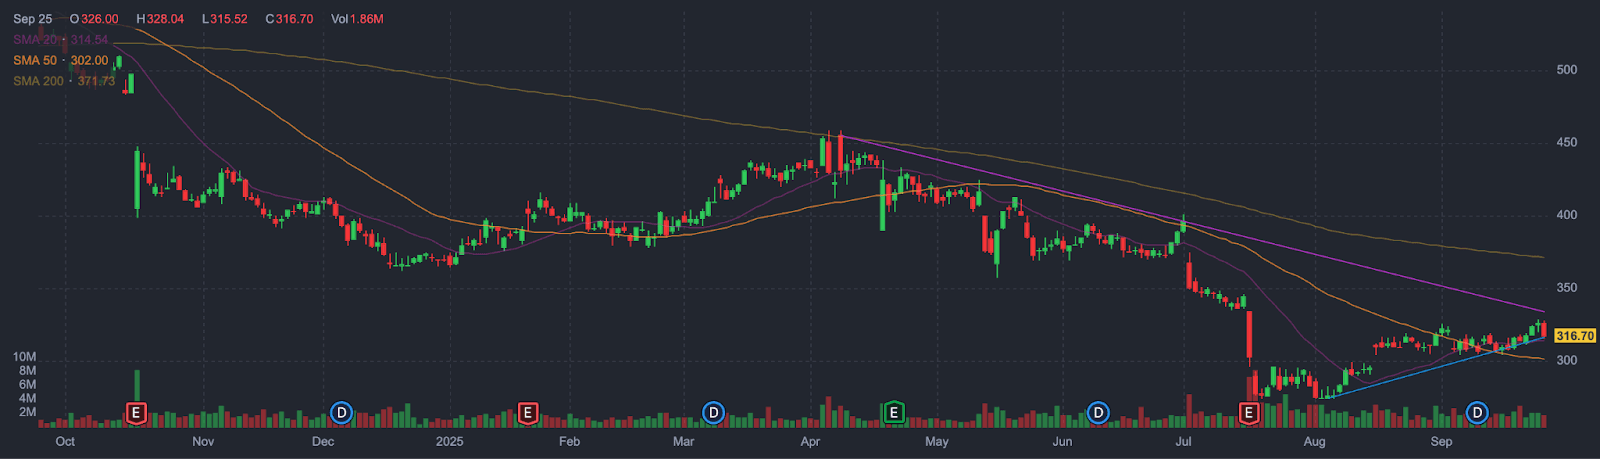
Elevance Health (NYSE: ELV) is trading near $317, continuing its rebound from August lows around $285. The stock has shown signs of stabilization after a long decline. Momentum indicators are improving as it tests key resistance levels.
From a trend standpoint, ELV is still in a broader bearish pattern but shows early signs of recovery. The stock trades above the 20-day moving average ($314.54) and the 50-day moving average ($302.00), both of which are rising. However, it is below the 200-day moving average ($371.73), which is still trending down. This situation reflects short-term strength within a longer-term decline.
Momentum indicators suggest better conditions. The RSI is at 59.18, moving up from oversold levels in the summer, indicating that buyers are gaining control. The MACD line (2.84) is above the signal line (1.73) with a positive histogram (+1.12), confirming bullish momentum as the stock builds on its recent support.
Structurally, ELV has broken out of a descending channel that has limited price since March. The $300 mark is now an important pivot. Volume has increased modestly on up days, showing steady accumulation, though significant resistance remains near the declining 200-day average and trendline resistance around $340.
Key upside levels to watch are $325 to $330 as initial resistance, followed by $350 if the momentum keeps going. On the downside, support is at $310 near the 20-day moving average, with stronger support at $300. A drop below $300 would weaken the current recovery effort and increase the risk of testing $285 again.
Elevance Health is showing positive signs of stabilization. Short-term moving averages are rising, and momentum indicators confirm improvement. While the long-term trend remains bearish, sustained strength above $325 would be an important milestone for building a stable base.
Booz Allen Hamilton - BAH - AI Score : 84.93
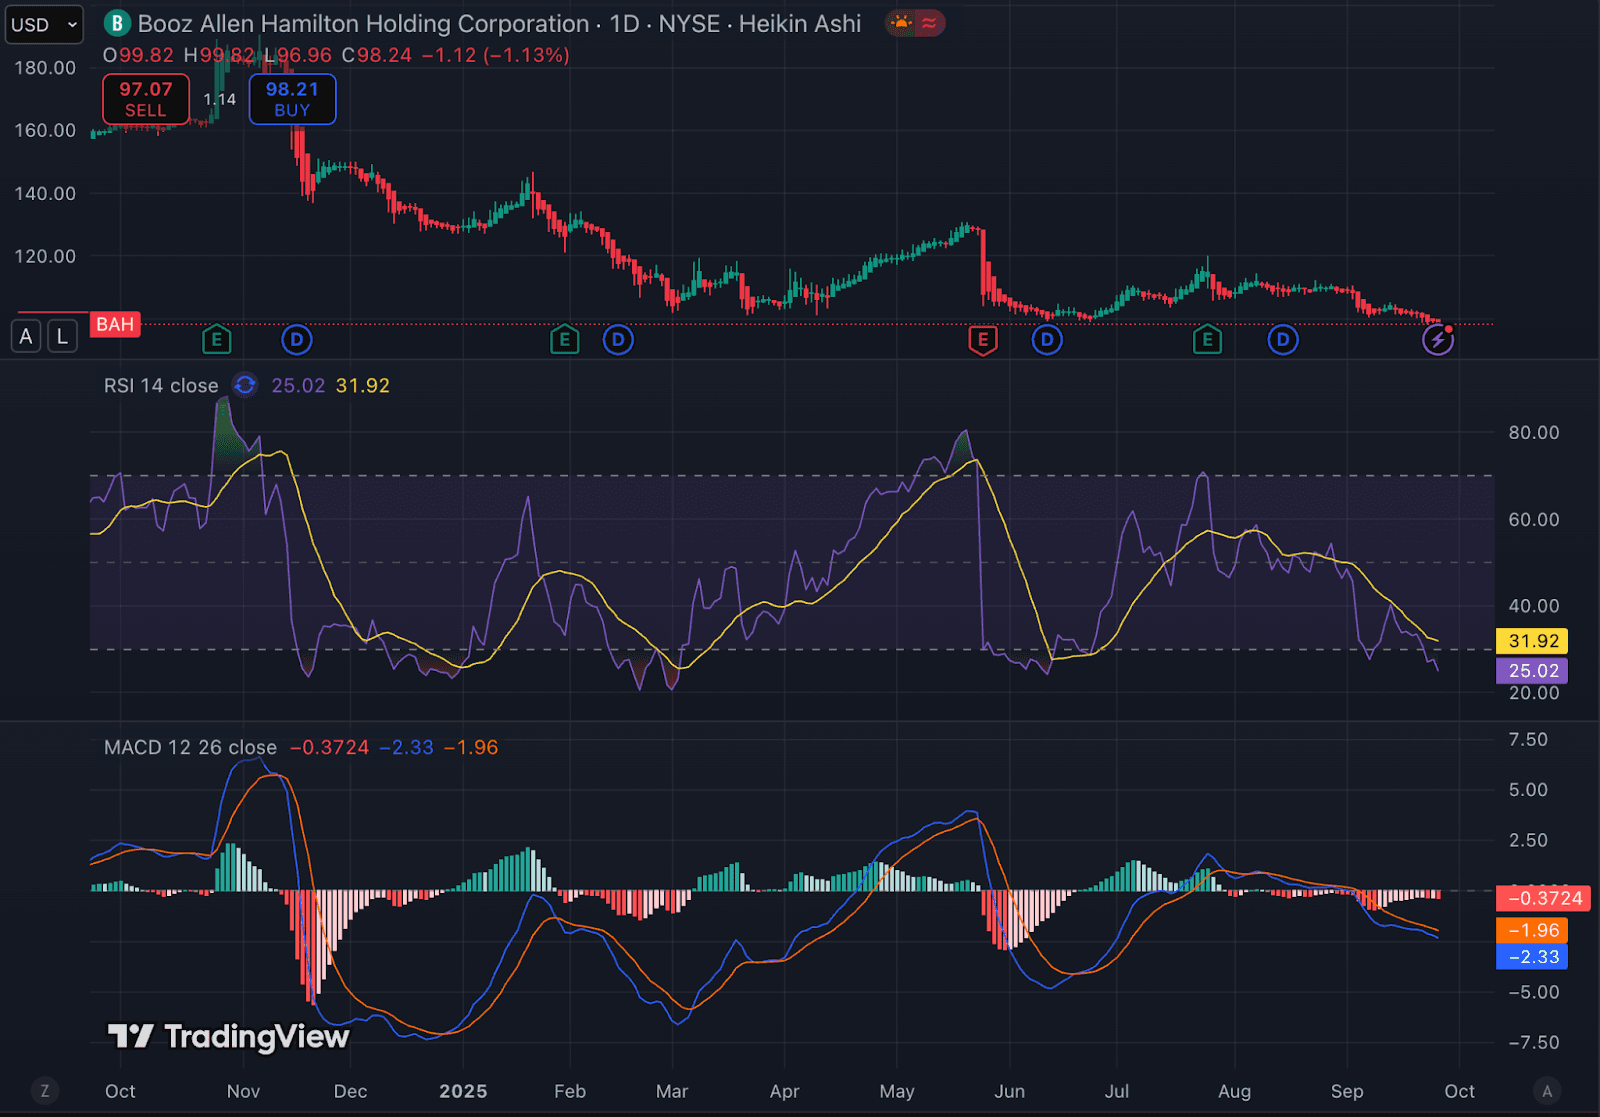
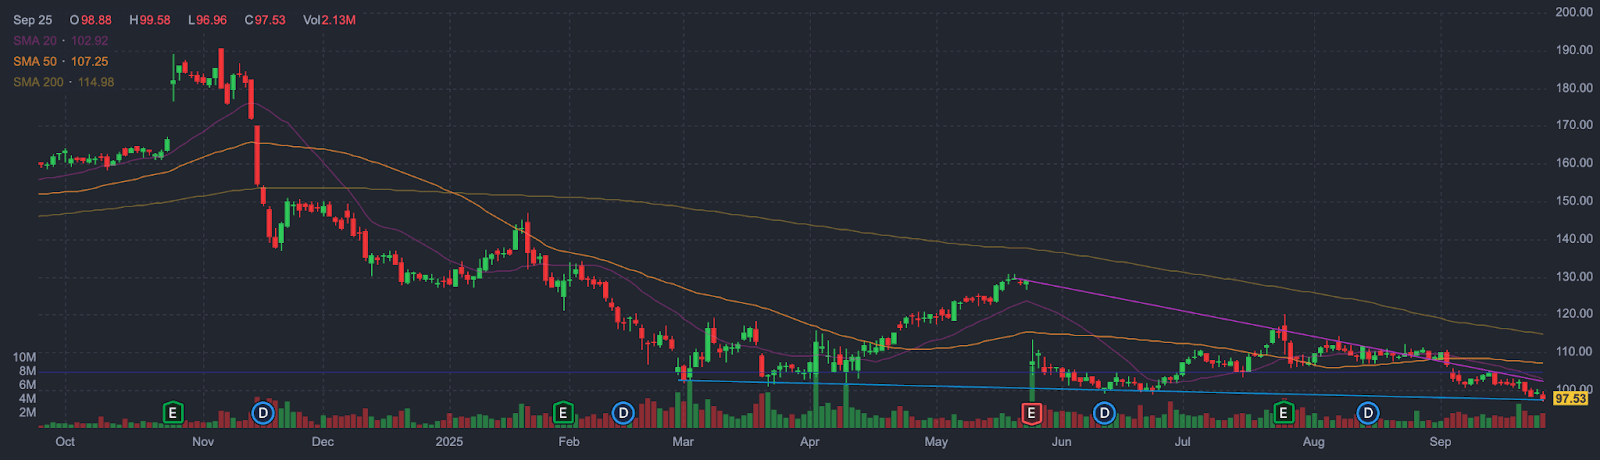
Booz Allen Hamilton (NYSE: BAH) is trading near $98. The stock continues to weaken after failing to stay around $110 this summer. It has been on a steady downtrend since late 2023, with recent prices moving toward multi-month lows.
From a trend perspective, BAH faces significant pressure. It trades below the 20-day average ($102.92), 50-day average ($107.25), and 200-day average ($114.98), all of which are sloping downward. This pattern shows strong downward momentum across all timeframes. The failure to regain even the shortest-term averages highlights the ongoing weakness.
Momentum indicators back up the negative outlook. The RSI sits at 25.02, well in oversold territory, indicating that selling pressure has been intense but may be close to exhaustion. This could lead to a technical bounce. The MACD line at –2.33 is below the signal line at –1.96, and the negative histogram at –0.3724 reflects ongoing downward momentum without any clear signals of a reversal.
Structurally, the stock has been stuck in a descending channel for most of the past year, with lower highs reinforcing the downtrend. Efforts to establish a base around $105 in August failed, and BAH has since dropped lower. Volume during recent down days has been high, showing that sellers are firmly in control.
Key support is around $95, a level not tested since early 2022. A drop below $95 would increase the risk of falling further into the low $90s. On the upside, initial resistance is at $105, with further resistance at $110 near the August high. A rise above the 50-day average at $107 would be the first sign of stabilization, though the overall trend would still be bearish until the stock regains the 200-day average at $115.
Booz Allen Hamilton continues to operate in a strongly bearish environment. Oversold conditions suggest possible short-term relief, but there is still no sign of a lasting bottom. The $95 level will be crucial in deciding whether the stock can stabilize or if further declines are likely.
Charter Communications - CHTR - AI Score : 83.99
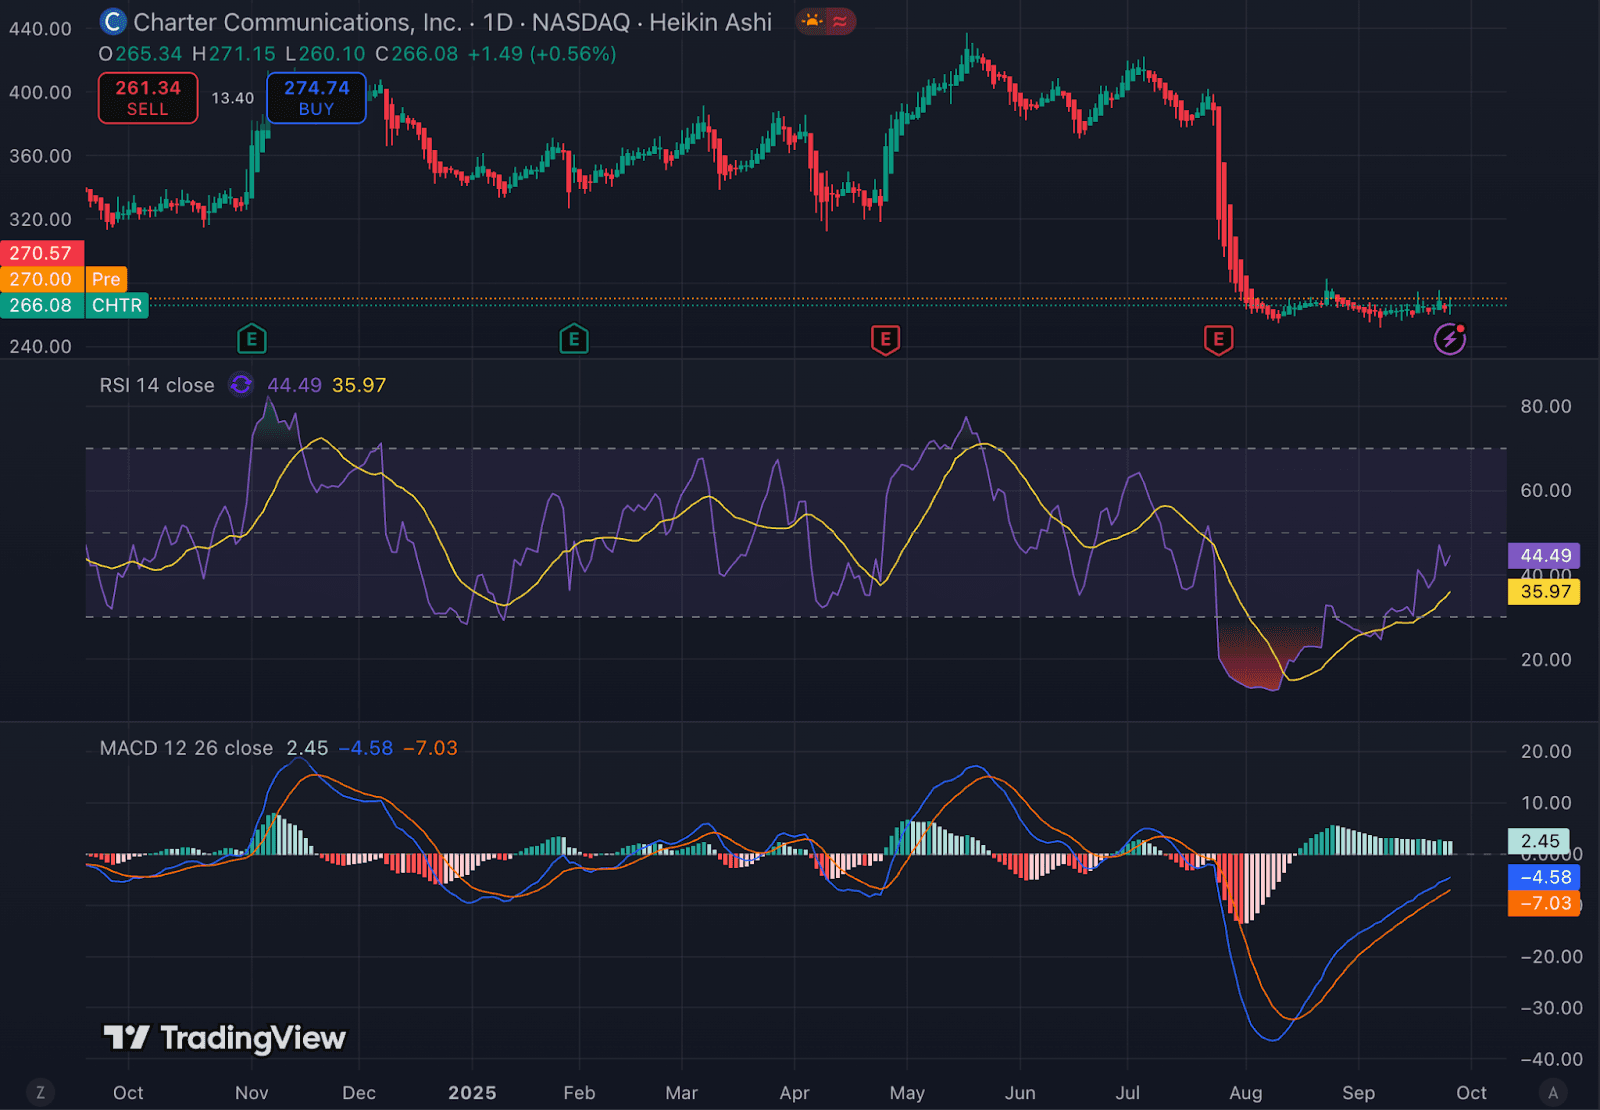
Charter Communications (NASDAQ: CHTR) is trading near $271 after bouncing back from a sharp selloff in August. This selloff dropped the stock from above $400 to around $260. While the stock has stabilized recently, it is still in a broader downtrend, and overhead resistance limits its recovery.
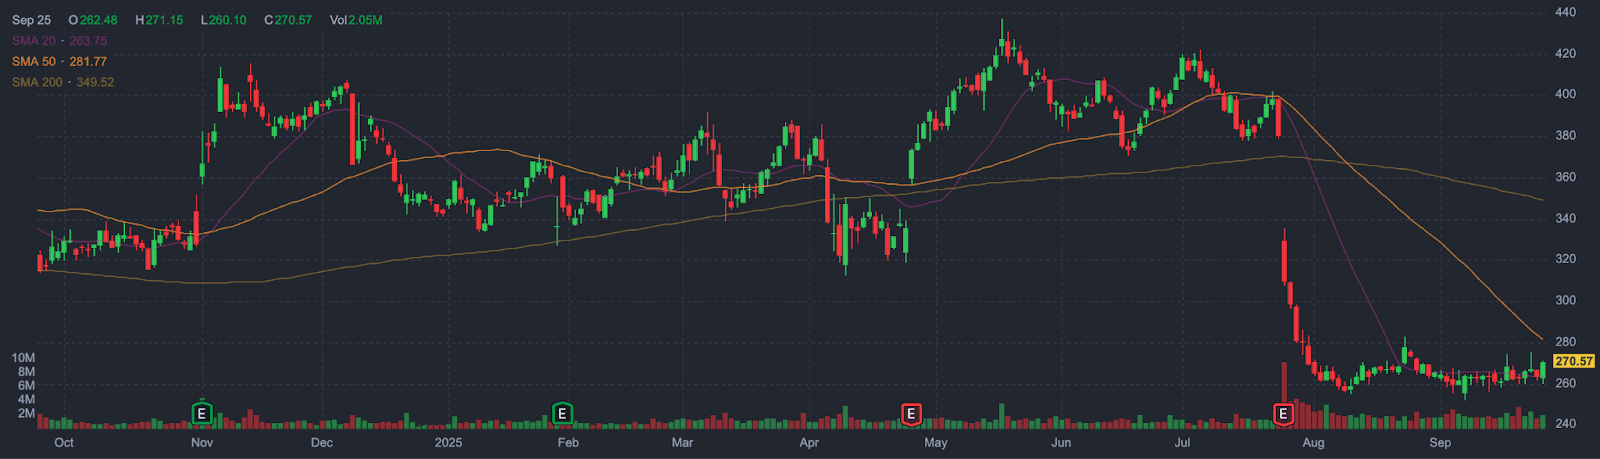
Looking at trends, CHTR is below the 20-day ($263.75), 50-day ($281.77), and 200-day ($349.52) moving averages, all of which are trending down. This pattern indicates ongoing downward pressure across short, medium, and long-term timeframes. Holding above $260 in September is a positive sign, but the stock needs to reclaim at least the 50-day average to suggest a more solid foundation.
Momentum indicators show some signs of improvement. The RSI is at 44.49, recovering from very low levels in August but still below neutral. This indicates that buying pressure is modest. The MACD line (-4.58) has crossed above the signal line (-7.03), and the histogram is positive (+2.45). These changes point to a potential shift toward early bullish momentum after a period of weakness.
Structurally, CHTR is consolidating in the $260 to $270 range after a sharp decline from July highs. Volume has decreased since the August drop, which suggests that selling pressure has eased, but buyer conviction remains weak. Until the price surpasses the $280 to $285 area, any upward moves are likely to encounter resistance.
Key support is at $260, which is the August low and the current consolidation floor. A drop below this level could lead to further declines toward $240. On the upside, resistance is at $282 near the 50-day SMA, followed by $300. Moving above $300 would be a significant milestone in rebuilding a longer-term base.
Charter Communications is working to stabilize after a sharp decline, with momentum indicators showing early signs of recovery. However, the overall trend remains down, and reclaiming the $282 to $300 range will be crucial for confirming a more lasting turnaround.
Advanced Micro Devices - AMD - AI Score : 83.89
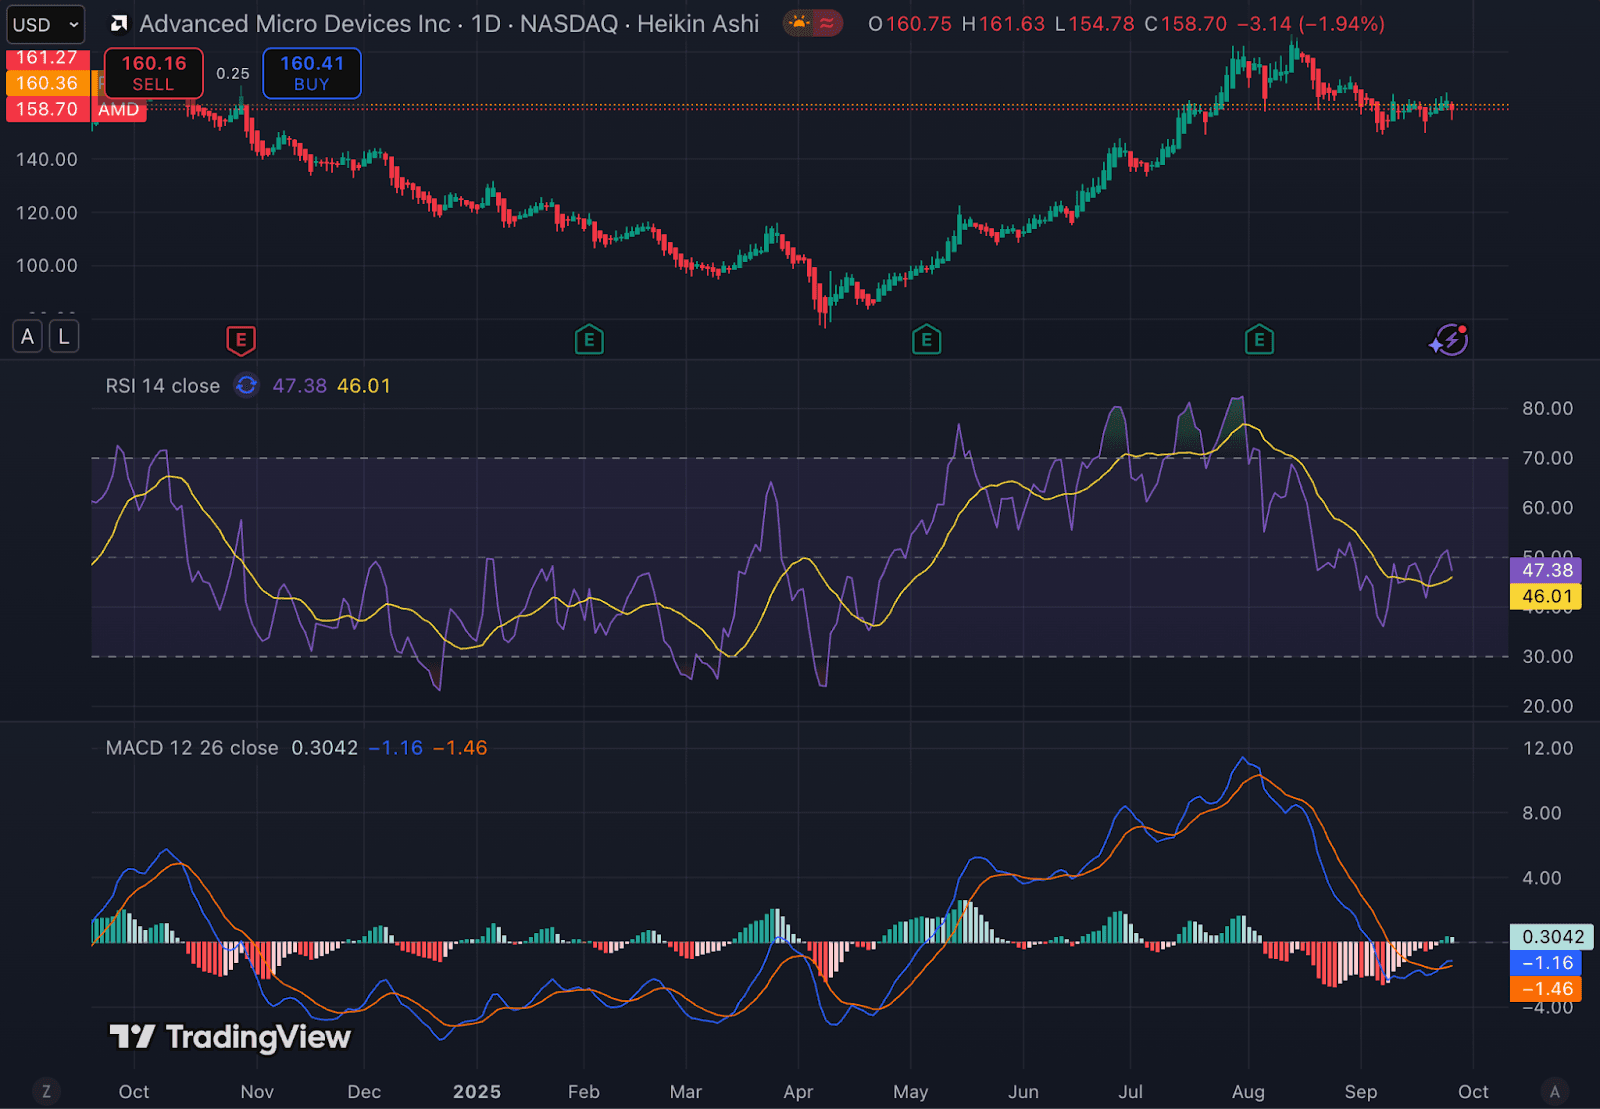
Advanced Micro Devices (NASDAQ: AMD) is trading near $161. It has been consolidating after dropping from its July peak above $180. The stock has maintained higher lows since its recovery in April, showing some resilience around the mid-$150s. However, momentum is still weak as it struggles to gain upward momentum.
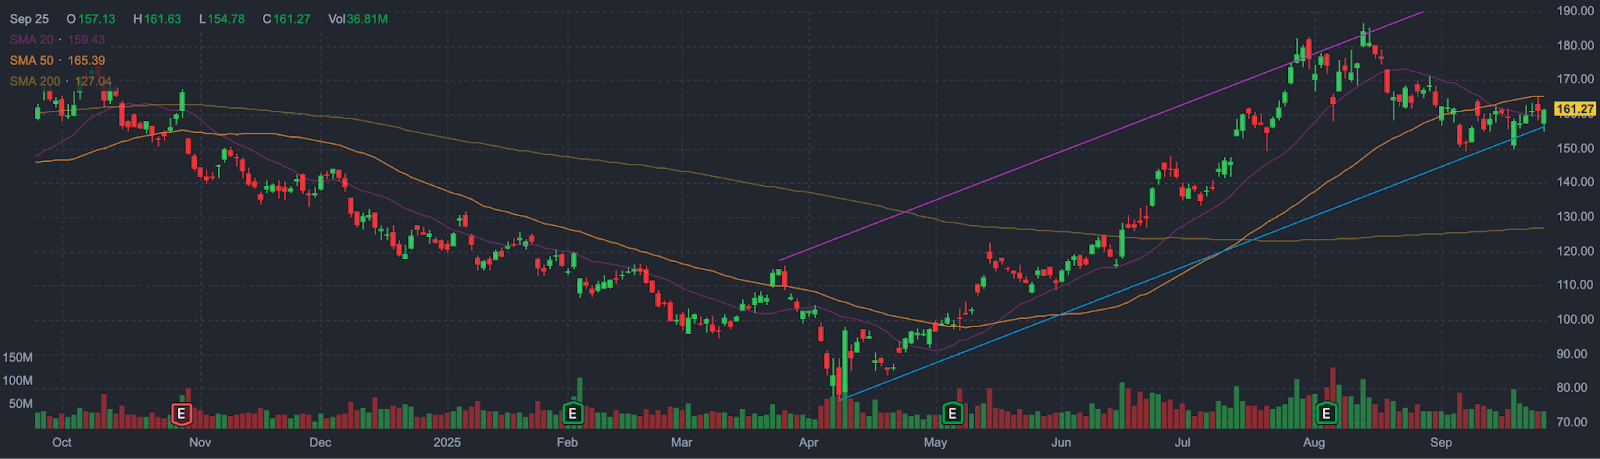
From a trend standpoint, AMD is mixed. It trades above the 200-day SMA ($127.04), which keeps its long-term bullish trend intact. It sits just below the 50-day ($165.39) and slightly above the 20-day ($159.43). This grouping shows a consolidative phase, with the rising trendline from April offering support around $155.
Momentum indicators are neutral. The RSI is at 47.38, suggesting no strong direction. The MACD line (-1.16) is below the signal line (-1.46), but the histogram is slightly positive (+0.3042). This implies that while bearish momentum has eased, buyers have not yet fully taken over.
Structurally, AMD remains in a rising channel created since April. However, it has struggled to stay above $170. The recent defense of support around $155 shows there is demand, but lighter trading volumes indicate uncertainty as investors await a clearer signal.
Key resistance levels are at $165 and $170, where the stock has faced repeated challenges. A breakout above $170 could lead to prices in the $180-$185 range. On the downside, initial support is at $155 around the channel base, with stronger support at $150. If it drops below $150, it could damage the positive channel pattern and risk a deeper pullback toward $140.
Advanced Micro Devices is consolidating within its broader uptrend. Its technical structure shows higher lows but faces ongoing resistance near $170. Staying above the 50-day moving average would signal encouragement, while maintaining $155 remains crucial to keeping the longer-term bullish setup intact.